Let’s look at a centralized repository on a project with an application that generates quite a lot of logs: more than 5000 lines per second. Let’s start working with this logs, adding them to ClickHouse.
As soon as the maximum realtime is required, the 4-core ClickHouse server will already be overloaded on the disk subsystem:
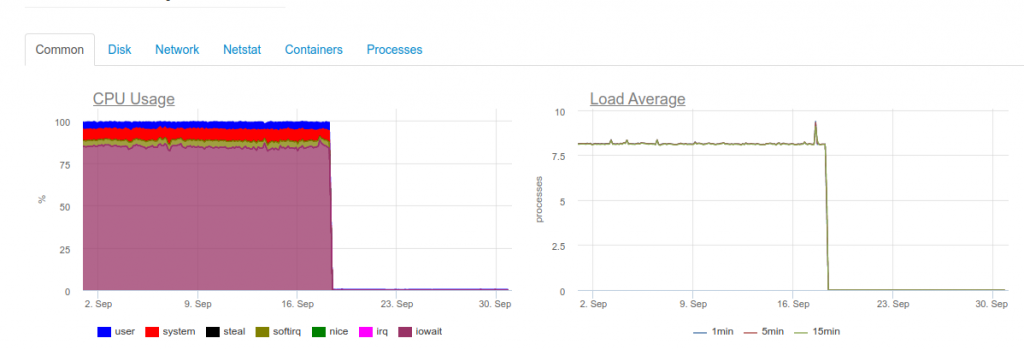
This type of download is due to the fact that we are trying to write as quickly as possible in ClickHouse. And the database responds to this with increased disk load, which can cause the following errors:
DB::Exception: Too many parts (300). Merges are processing significantly slower than inserts
The fact is that MergeTree tables in ClickHouse (they contain log data) have their own difficulties during write operations. The data inserted into them generates a temporary partition, which then merges with the main table. As a result, the recording is very demanding on the disk, and it also has a restriction, the notification of which we received above: no more than 300 subpartitions can merge in 1 second (in fact, this is 300 inserts per second).
To avoid this behavior, you should write in ClickHouse in as large parts as possible and not more often than 1 time in 2 seconds. However, writing a lot suggests that we should write less often in ClickHouse. This, in turn, can lead to buffer overflows and loss of logs. The solution is to increase the Fluentd buffer, but then memory consumption will increase.
Note: Another problem with our ClickHouse solution was that partitioning in our case (loghouse) was implemented through external tables linked by a Merge table. This leads to the fact that when sampling large time intervals, excessive RAM is required, since the metatable goes through all partitions – even those that obviously do not contain the necessary data. However, now this approach can be safely declared obsolete for current versions of ClickHouse .
As a result, it becomes clear that far from every project will have enough resources to collect logs in real-time in ClickHouse (more precisely, their distribution will not be expedient). In addition, you will need to use a battery, to which we will return. The case described above is real. And at that time we could not offer a reliable and stable solution that would suit the customer and allow to collect logs with a minimum delay .
What about Elasticsearch?
Elasticsearch is known to handle heavy loads. Let’s try it in the same project. Now the load is like this:
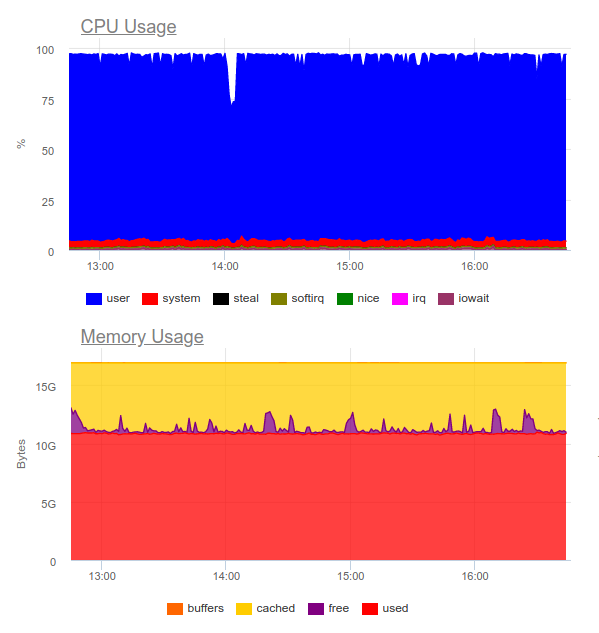
Elasticsearch was able to work on the data stream, however, writing such volumes to it greatly utilizes the CPU. This is decided by the organization of the cluster. Purely technically this is not a problem, but it turns out that only for the operation of the log collection system we already use about 8 cores and have an additional highly loaded component in the system …
This option can be justified, but only if the project is large and its management is ready to spend significant resources on a centralized logging system.
Then a logical question arises:
What logs are really needed?
Let’s try to change the approach itself: the logs should be informative at the same time, and not cover every event in the system.
Let’s say we have a prosperous online store. Which logs are important? Gathering as much information as possible, for example, from a payment gateway is a great idea. But not all logs are critical for us from the image slicing service in the product catalog: only errors and advanced monitoring are enough (for example, the percentage of 500 errors that this component generates).
So we came to the conclusion that centralized logging is far from always justified. Very often, the client wants to collect all the logs in one place, although in fact only 5% of the messages that are critical for business are required from the entire log:
- Sometimes it’s enough to configure, only the size of the container log and the error collector (for example, Sentry).
- To investigate incidents, error alerts and a large local log itself can often be enough.
- We had projects that completely costed exclusively with functional tests and error collection systems. The developer did not need the logs – they saw everything on error traces.
A good example is another story. We received a request from the security team of one of the clients who already used a commercial solution, which was developed long before the implementation of Kubernetes.
It took to “make friends” a centralized log collection system with a corporate sensor for detecting problems – QRadar. This system is able to receive logs using the syslog protocol, to take it from FTP. However, integrating it with the remote_syslog plugin for fluentd did not work right away (as it turned out, we are not the only ones who didn’t succeed). Problems with configuring QRadar were on the side of the client’s security team.
As a result, part of the logs critical for business were uploaded to FTP QRadar, and the other part was redirected via remote syslog directly from the nodes. To do this, we even wrote a simple chart – perhaps it will help someone solve a similar problem … Thanks to the resulting scheme, the client himself received and analyzed critical logs (using his favorite tools), and we were able to reduce the cost of the logging system, keeping only the last month.
Another example is quite indicative of how not to do it. One of our clients to handle each event coming from the user, did multiline unstructured output of information to the log. As you might guess, such logs were extremely inconvenient to read and store.
Criteria for Logs
Such examples lead to the conclusion that, in addition to choosing a system for collecting logs, you must also design the logs themselves! What are the requirements here?
- Logs must be in a machine readable format (e.g. JSON).
- Logs should be compact and with the ability to change the degree of logging in order to debug possible problems. At the same time, production systems should run systems with a logging level like Warning or Error.
- Logs must be normalized, what means, in the log object, all lines must have the same field type.
Unstructured logs can lead to problems with loading logs into the repository and stopping their processing completely. To illustrate, here is an example with a 400 error, which many people have definitely encountered in the fluentd logs:
2019-10-29 13:10:43 +0000 [warn]: dump an error event: error_class=Fluent::Plugin::ElasticsearchErrorHandler::ElasticsearchError error="400 - Rejected by Elasticsearch"
An error means that you are sending an index with a ready mapping’s field whose type is unstable. The simplest example is a field in the nginx log with the variable $ upstream_status. It can have either a number or a string.
{ "ip": "1.2.3.4", "http_user": "-", "request_id": "17ee8a579e833b5ab9843a0aca10b941", "time": "29/Oct/2019:16:18:57 +0300", "method": "GET", "uri": "/staffs/265.png", "protocol": "HTTP/1.1", "status": "200", "body_size": "906", "referrer": "https://example.com/staff", "user_agent": "Mozilla/5.0 (Windows NT 10.0; Win64; x64) AppleWebKit/537.36 (KHTML, like Gecko) Chrome/78.0.3904.70 Safari/537.36", "request_time": "0.001", "cache_status": "-", "upstream_response_time": "0.001, 0.007", "upstream_addr": "127.0.0.1:9000", "upstream_status": "200", "upstream_response_length": "906", "location": "staff"}
{ "ip": "1.2.3.4", "http_user": "-", "request_id": "47fe42807f2a7d8d5467511d7d553a1b", "time": "29/Oct/2019:16:18:57 +0300", "method": "GET", "uri": "/staff", "protocol": "HTTP/1.1", "status": "200", "body_size": "2984", "referrer": "-", "user_agent": "Mozilla/5.0 (Windows NT 10.0; Win64; x64) AppleWebKit/537.36 (KHTML, like Gecko) Chrome/78.0.3904.70 Safari/537.36", "request_time": "0.010", "cache_status": "-", "upstream_response_time": "0.001, 0.007", "upstream_addr": "10.100.0.10:9000, 10.100.0.11:9000", "upstream_status": "404, 200", "upstream_response_length": "0, 2984", "location": "staff"}
The logs show that the server 10.100.0.10 answered with the 404th error and the request went to another content store. As a result, in the logs, the meaning has become like this:
"upstream_response_time": "0.001, 0.007"
This situation is so widespread that it even won a separate mention in the documentation.
And what about reliability?
There are times when all the logs are vital without exception. And with this, the typical logging schemes for K8s proposed / discussed above have problems.
For example, fluentd cannot collect logs from short-lived containers. In one of our projects, the container with the database migration lived for less than 4 seconds, and then was deleted – according to the corresponding annotation:
"helm.sh/hook-delete-policy": hook-succeeded
Because of this, the migration log did not get into the repository. The before-hook-creation policy can help in this case.
Another example is the rotation of Docker logs. Suppose there is an application that actively writes to the logs. Under normal conditions, we manage to process all the logs, but as soon as a problem arises – for example, as described above with the wrong format – processing stops, and Docker rotates the file. As the result – business-critical logs may be lost.
That is why it is important to separate the flow of logs by embedding the sending of the most valuable directly into the application to ensure their safety. In addition, it will not be superfluous to create a kind of “battery” of logs that can survive the brief unavailability of the storage while maintaining critical messages.
Finally, do not forget that it is important to monitor any subsystem in a quality manner. Otherwise, it is easy to encounter a situation in which fluentd is in the CrashLoopBackOff state and does not send anything, and this promises a loss of important information.
Conclusions
In this article, we do not consider SaaS solutions like Datadog. Many of the problems described here have already been solved one way or another by commercial companies specializing in collecting logs, but not everyone can use SaaS for various reasons.
The centralized collection of logs at first looks like a simple task, but it is not at all. It is important to remember that:
- Logging in detail is only critical components, and for other systems you can configure monitoring and error collection.
- Logs in production should be minimized so as not to give an extra load.
- Logs must be machine-readable, normalized, have a strict format.
- Really critical logs should be sent in a separate stream, which should be separated from the main ones.
- It is worth considering a battery of logs, which can save from bursts of high load and make the load on the storage more uniform.
These simple rules, if applied everywhere, would allow the circuits described above to work – even though they lack important components (battery). If you do not adhere to such principles, the task will easily lead you and the infrastructure to another highly loaded (and at the same time ineffective) component of the system.