There are many types of software testing: unit, functional, A / B testing, integration, load, etc. And in our opinion, the last one is both the most important and the most difficult. After all, if errors that can be detected using A / B tests, unit, functional and integration tests appear almost immediately after the “rolling out” of a new version of the application, then the problems that load testing is aimed at identifying are “sleeping”. And they are detected only when a new version of your site or application receives real user traffic that the “software” part of the project (database, application server) or the “hardware” part (lack of RAM in the cluster, large load on the disk subsystem during read-write operations).
In this article, we will tell and show how we conduct, perhaps, reference load testing – in terms of completeness of coverage and completeness of the resulting report. Our developments are quite reproducible, so you can use them to improve the work of your own project.
What? Where? When?
When needed:
- an assessment of the current project performance limit is needed (for example, before some promotions, mailings, Black Friday, etc.) – in order to assess the amount of temporary capacity increase and changes in the project configuration for the period of the promotion;
- you are looking for ways to improve the performance of the current architecture / infrastructure (search for problem areas / bottlenecks) on an ongoing basis;
- you need to test a new project before launching into production or a new infrastructure after moving.
What’s included:
- audit of the current infrastructure,
- compiling load testing scenarios and choosing tools for its implementation,
- load testing,
- drawing up a report on the results with recommendations for solving the identified problems.
Where to see:
- technology stack – with the help of what tools, PL, frameworks the project works: it can be either a typical monolithic website on the LAMP / LEMP stack, or a microservice project consisting of 30 services written in various PLs (typescript, golang, python …); whether any additional software is used (caching systems, full-text search systems, etc.)
- working capacities are iron servers or cloud VMs with connected autoscaling, a managed Kubernetes cluster, etc.
- data storage (both database and uploaded user files) – whether the database is on-premise or managed, whether replication is configured (writing to the master / reading from the slave), etc. Where the uploaded user data is stored – local disk, s3- storage, etc.
- interaction of project components with each other – how they are connected, which subsystems are used and in what order they process an incoming user request; if the project is built on a microservice architecture, how services communicate with each other; whether there are any external dependencies (payment gateway API, email service), and if so, how communication with these services is carried out.
- auxiliary components – whether the project has monitoring, a system for collecting logs and traces, which can be useful in the process of load testing to obtain additional data and insights.
Infrastructure audit helps to better understand the logic of the project, as well as immediately find possible bottlenecks, for example, a synchronous request to the payment system when paying for an order in an online store; lack of a caching system for static content (a page on the news portal, including an additional section “on the same topic”). And we use data from existing monitoring systems and collecting logs to improve testing scenarios and find bottlenecks.
Test scenarios and tool selection
Scenarios
In an ideal world, test scripts should fully simulate user behavior on the site – page navigation, authorization and authentication procedures, password reset and change, adding / removing products to the basket, placing an order, etc.
When we performed load testing for Total Dictation, the scenarios described the following processes:
- user authentication on the site,
- filling and intermediate saving of the dictation,
- sending the dictation for verification.
The most common options for the formation of the final scenario in our practice are as follows:
- the customer himself formulates a set of scenarios that need to be implemented – the most ideal and easiest way 🙂
- scenarios are formed jointly by our specialists with the customer’s team – for example, if testing is scheduled before a promotion or a regular seasonal load, and the set of criteria is more or less clear.
- the customer wants testing, but cannot formulate the exact criteria – in this case, we analyze the access logs of the web server, for example, for the last month, discard requests for static files from them and form a set of scenarios for testing from them, thereby covering most of the user behavior on the site.
Tools
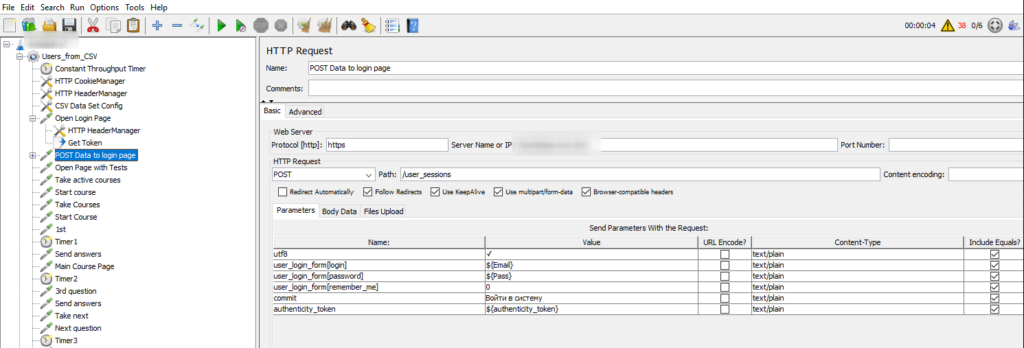
Apache JMeter is a load testing tool developed by the Apache Software Foundation . Although originally designed as a web application testing tool, JMeter is currently capable of load testing JDBC, FTP, LDAP, SOAP, JMS, POP3, IMAP, HTTP, and TCP connections. An interesting possibility is the possibility of creating a large number of requests using several computers while managing this process from one of them. The architecture supports third-party plugins, which allows you to add new features to the tool.
A more heavyweight and resource-intensive tool, but with wider functionality: it allows you to add cookies, headers (for example, for authorization) to http requests, parse pages to get the value of certain variables and use them in subsequent requests; ultimately, it makes it possible to fully emulate the work of the browser. We use JMeter in three ways:
- manual filling of the query plan (adding urls, headers, etc.),
- import from curl (we take it from the developer console in the browser),
- proxy (we direct traffic from the browser through JMeter, manually “click” the site, JMeter draws up a test plan based on this data).
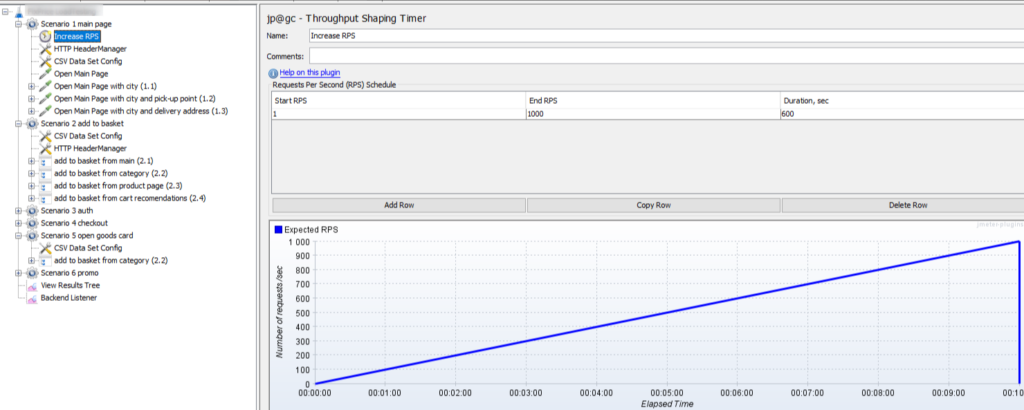
Of the minuses – there are no built-in charts, you have to additionally configure the connection with Grafana (which, however, is done quite easily). Of the benefits – a large community + a large number of plugins for testing anything (in our big data platform , we use JMeter to generate streaming data for Apache Kafka and further processing through Apache Spark).
Self testing and reports
After preparing the scenarios and choosing the tools, it is the turn of the simplest – from an organizational point of view, but the most responsible – from the point of view of the result. Yes, we are talking about the load testing procedure itself. Since its main goal is to evaluate the performance of the production environment, you must perform the following steps before running the tests:
- agree on a technological window for testing – a time is selected at which the system will be under minimal load from live users (usually this is the interval between night and early morning) and during which there will be no imports, mailings, backups, etc. .
- coordination with developers / ops – during testing, firstly, no work on the project should be carried out by the customer (for example, deploying a new version); secondly, in the process of load testing, the site can completely “fall” and you need to have a recovery plan at hand / the ability to quickly find the source of the problem and fix it.
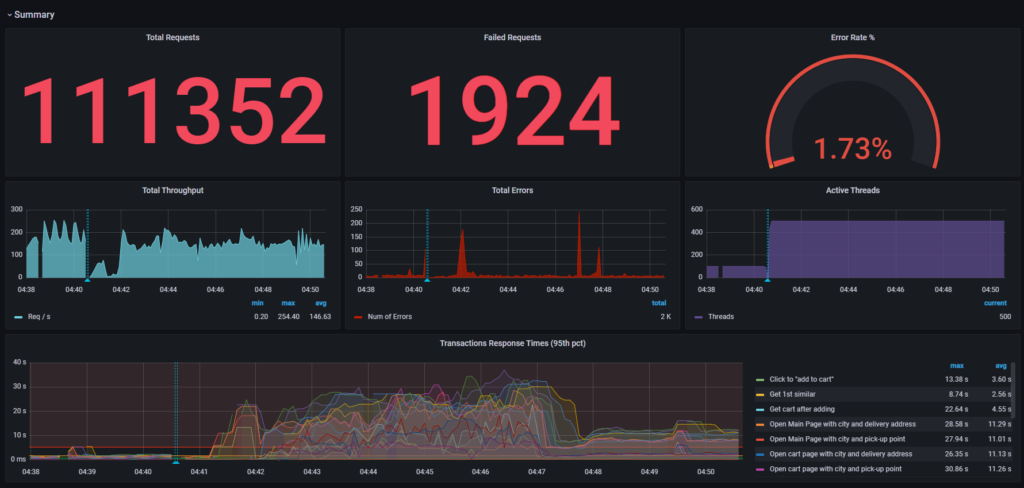
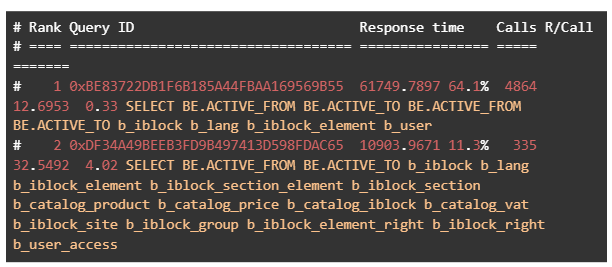
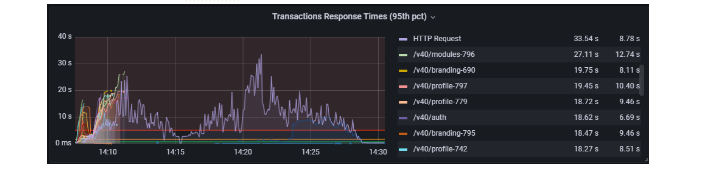
As a result of load testing at the output, we get a set of graphs – the dependence of the page response time on the RPS of the incoming load and the utilization of resources depending on the RPS – based on which in the final report we show both the current capabilities / limits of the system, and recommendations for increasing project performance . These recommendations may refer to the infrastructure level (lack of autoscaling mechanisms, problems at the network level) and to the level of architecture and code base (non-optimized SQL queries, lack of indexes in the database, outdated bitrix kernel; non-optimal distribution of read / write operations between the master / slave database) .
Below are examples with recommendations based on the results of load testing.
At the moment, recommendations based on test results:
a) Reduce timeouts in node bitrix-frontend-app so that the client does not wait 60 seconds before a 504 error appears and thus connections are not clogged.
b) Increase the parameters for vault so that api correctly receives secrets from it, and also does not hang waiting for a response.
c) After all, explore the network settings.
d) Add imaginary resources, because when loading resized images, it steadily falls.
e) Correct the work of the CDN, because even after the tests are completed, it consistently returns 502 response codes.
f) Raise the logging level in bitrix-frontend to debug problems and eliminate their causes.

Next, we put one interesting example from practice: the client needed an additional educational system for training employees. We’ve done load testing on both.
Total:
Site 1 has problems with network bandwidth and load on the application server. The average system response time (excluding video loading) is kept at 5-7 seconds with an average of 260 RPS and no timeout errors.
Site 2 has problems with excessive load on the worker servers, and at an average of 205 RPS, pages are rendered significantly longer.
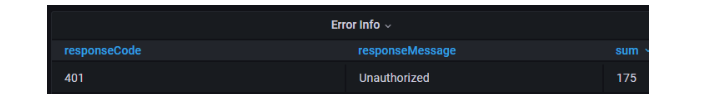
Also, due to problems with the return of the js-file, some of the test users could not pass authorization and, accordingly, could not pass the test at all.
What’s the use, brother?
Like any preventive checks, periodic load testing will undoubtedly have a positive impact on the development of your product / service. In an ideal world, if there is a stage (preprod) site identical to production, load testing can be built directly into CI / CD processes when laying out a new version of the project for pre-production.
In addition, it helps to identify errors both in the project architecture and in its code base. In our practice, there was an interesting example when a stage project deployed in a K8s managed cluster withstood only 8 RPS, and then crashed until all deployment pods were restarted. After three iterations of load testing (with a difference of a week), the performance increased to 110 RPS.
To summarize: unlike various other testing (and not only in IT – see the beginning of the article), load testing is not just a statement whether the patient is “sick” or not, it is a total and exhaustive study of the project in terms of bottlenecks that can become the reason for the failure of the site or service when the load increases. And, in our case, also a roadmap for troubleshooting.
So take care of the health of the project and do not forget to check it in time!