The material will be useful to people who are starting their journey in this direction, and will help to understand what you need to pay attention to in the first place and how to facilitate the process of conducting inspections.
News from the client
“3000. No, better than 5000 users! – Somehow we heard from the client along with the news that he plans to attract active users to the application.
What is coming? What is the first thing that comes to your mind when you hear about the increase in the number of users in the application from 170 to 5000? What features will interest these users or what platforms will get more downloads? Of course, these are important points. But the first thought is that the server does not fall.
Planning
To begin with, we found out from the client the main goals of the marketing campaign, as well as which functional parts of the application he would like to attract the most users to.
In an ideal world for load testing , you need to test everything in the application, from registration to logout. But with a limited deadline, optimization and compromises come to the rescue.
The plan was this:
- Select features for load testing and prioritize them.
- Decide on the tools for conducting load testing.
- Make a plan and make calculations.
- Create a separate environment for testing.
- Conduct manual testing to check if everything is fine with the frontend part of the program while working with a large number of users. And fix bugs.
- Make a test plan and test the load on a small number of users (10-20). Fix the bugs that have arisen.
- Conduct checks for more users, gradually increasing the load on the server and fix the bugs that have arisen.
- Understand what is the maximum number of active users that the application can “support”.
- Provide a report to the client.
Apache JMeter was chosen as the load testing tool. Its functions allow you to carry out checks in a short time and test scripts are easily kept up to date, which will come in handy if you need to test again.
Setting up before starting
Firstly. From the QA side, they made a plan for checks and calculations, and the backend team, together with the devops, deployed a new environment. By default, the test environment is not designed to work with a large amount of data sent to the server.
Therefore, our specialists performed the settings on a new environment with the ability to connect additional capacities (servers) with an increase in load.
Secondly. The test plan is ready and agreed, the environment is deployed. And we started doing manual checks.
During the tests, several functional bugs were quickly found related to the logic of the application itself.
We also found “losses” in the form of not entirely relevant and unnecessary requests that remained from older versions and significantly slowed down the application.
First checks under low load
While the first bugs were being fixed on the application side, a test plan of agreed features was deployed in JMeter. We started the first checks for a small number of users.
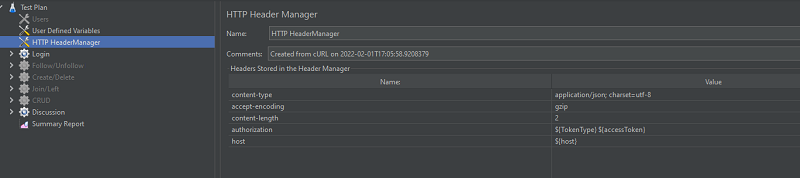
The test plan consisted of 6 groups.
- login.
- Follow/Unfollow entities 1.
- Create/Delete entities 2.
- Join/Left entities 3.
- CRUD with entity data 4.
- Discussion (working with chats is the most insidious and most interesting thing to test).
By the time the checks were carried out, there were already 170 active users in the application, so the first checks on the server load were successful. It was also pleasing that all the bugs found during the preliminary manual testing had already been fixed.
Increasing the load, the number of errors and finding their solutions
We began to increase the capacity and the number of users. To begin with, checks were carried out for each thread separately. Tests 10, 25, 50, 100, 200 users – everything worked pretty well. The login worked “like clockwork”, but the “problems” started when loading other entities – some of the checks simply gave 500 errors on 300 users.
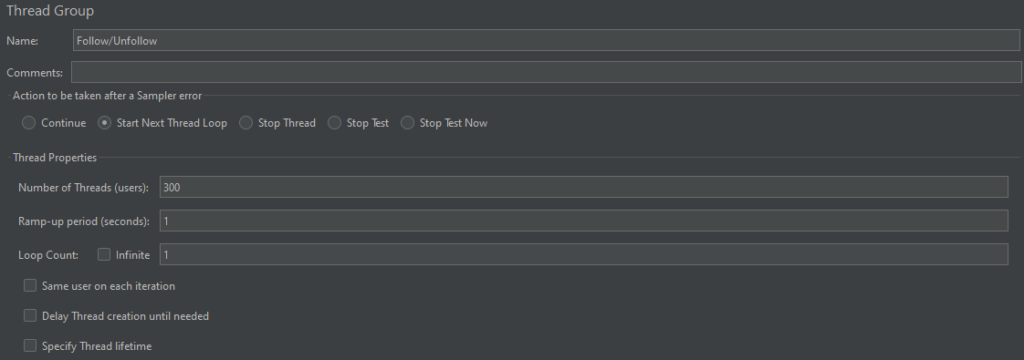
On the screenshot of the test settings. Let’s assume that in a thread group 5 requests are executed sequentially with 300 users working with a delay of 1 second. Will queries work as they should?
The answer is no, the server will return errors.
If the number of users increases, you need to pay attention to the Ramp-up period and allow the server to keep up with everything within the allowed time. That is, a scenario where we give one second for one user to execute, say, 5 requests containing a different set of data (by the number of parameters sent) within one thread group will be bad and unrealistic.
The value of the period is determined using measurements of the time to execute manual script verification – the average value between the time to execute queries with required and all parameters.
After increasing the ramp-up period, there were fewer errors, but they still occurred.
You should pay attention to the set of requests run within one thread and the speed of their processing by the server. Sometimes entities do not have time to form, so it is impossible to work with them further.
In our case, for 300 users, a Ramp-up period of 30 seconds was acceptable and realistic, that is, for further checks, the minimum ratio of the number of users to the Ramp-up period was 10 to 1.
It’s time to connect several threads to work at the same time.
A load of 300 users in each of the threads simultaneously launched for checks gave its result – 500 errors rained down. The server could not withstand the load with the simultaneous work of 1800 users. Work has begun on the side of the backend team to optimize queries.
At the same time, on the JMeter side, in test scenarios, optimization was also carried out with the login and data that are passed to query parameters.
If the test plan has several independent threads running simultaneously, you need to remove the login from the threads. That is, you should login once during the checks and just pass the tokens to other threads. So the checks will be optimized and closer to real flow users.
A small optimization of the test plan and fixes on the backend side allowed us to increase the load and look at the server’s work. At 4000 concurrent users, chat checks began to partially break. And again – 500 .
If there are parameters in the checks that can be generated or selected randomly, we use this opportunity and connect them randomly. These can be: sending text messages, generating entity names, working with sending media, etc.
The post consists mainly of media and text. For such cases, you can use random:
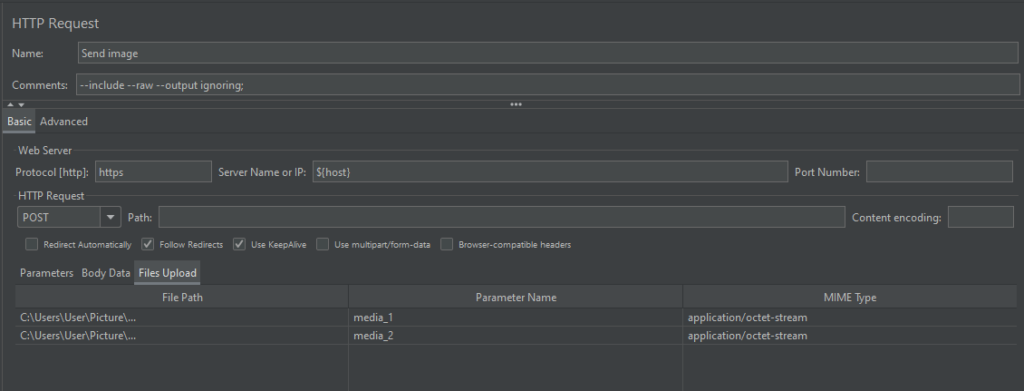
- We will first prepare the media and text that we will work with in the future.
- For media, you need to select several supported photos and videos of various formats and sizes. They can be stored locally on a PC or in the cloud storage of the project (the second option is better, given the work with tests for all team members). Then you need to specify the path to store these files in the HTTP Request and specify the name of the parameter, indicating its conditional id (media_id):
- For text, a dictionary or your own text that can be put into a variable is perfect (but remember about censorship – do not forget that everything that gets to the server, and then to the program itself, may be available to other members of your or client team) ) .
- When executing a request, instead of the default parameters for each user, using the prescribed script in PreProcessor, we send a randomly selected media or a set of words / phrases from an array of text.
In the case of text, it is enough to use a function in the script that splits the string (our text) into substrings and, using the random function, will select any of them and send it as a parameter in the request body.
In the case of media, we use the random function, which will generate a number from zero to the total number of media that we use in testing. After that, we substitute the generated number as id in the name of the media variable (media_randomId) and pass it as a parameter in the request body.
When working with randomness, you should pay attention both to the implementation through the script language you are writing with, and to the standard randomness function in JMeter:
${__Random(p1, p2, p3)}, where P1 and p2 are the lower and upper limits of the random number respectively, and p3 is the name of the variable where the randomly selected number will be stored.
From the side of the backend, research has been carried out, requests for chats have been optimized, and server settings and tariff plans have been revised.
When it comes to scaling a project, you should think that working with only one server may not be enough, because it has a limited capacity. Therefore, when the project raises the question of increasing users or the load on the server part, you should think about expanding the capabilities of the server or connecting additional ones to distribute the load.
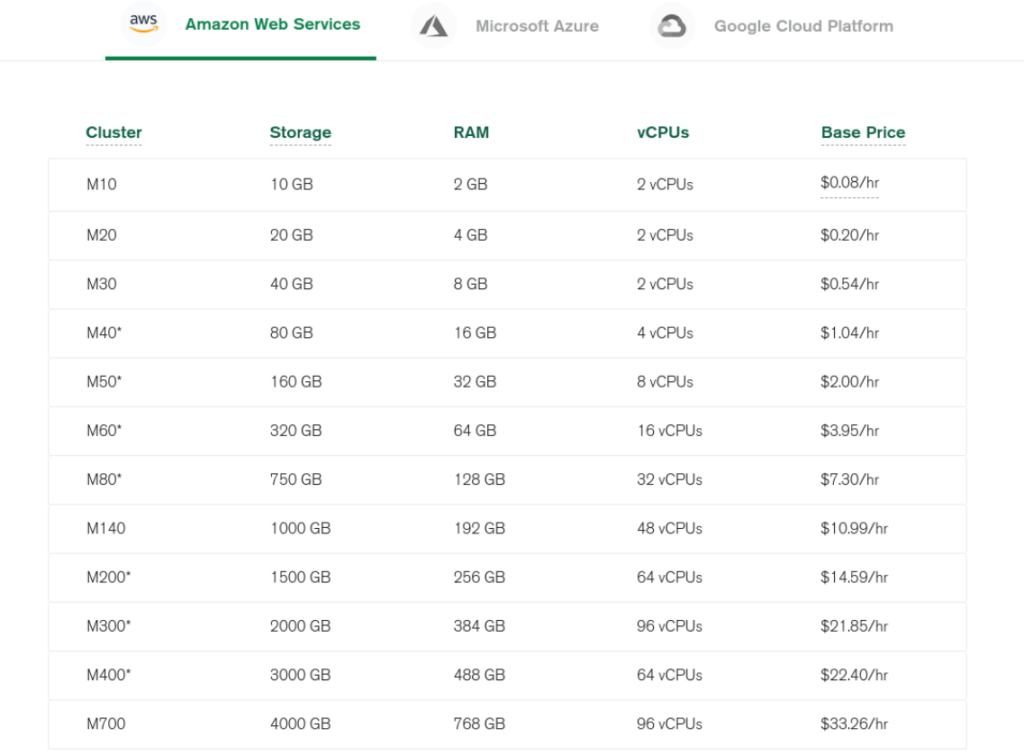 When the load on the server increases, the amount of RAM, CPU, etc. increases. Thus, as the load increases, there is a need to connect additional capacities and there is a transition to the next tariff plan (M10, M20, etc.), and additional servers are connected – horizontal and vertical scaling.
Think about the server – don’t forget to think about your workstation. In order not to overload the CPU on your computer, you should run tests not from the JMeter GUI, but from the console, remembering to save the test results to a file for analysis.
For 3 days, we continuously loaded the server, starting all the threads at the same time. Each of them had from 500 to 1500 users. Errors could only occur when additional servers connected to help. As a result of testing and optimization, we reached stability in working with 3000-9000 users.
The result of the work done
We presented progress reports to the client and agreed that a load of 9,000 active users with a planned increase to 20,000 registered users is a very good result, which we were able to achieve in a short time. For the final reports, we used those generated during the last day of testing.
For a more visual result, one could additionally connect Grafana, which would provide an interactive visualization for analytics.
If you want to provide reports to the client more clearly, you should combine graphical reports that can be generated in JMeter itself, visualization of reports in Grafana and tabular reports from JMeter.
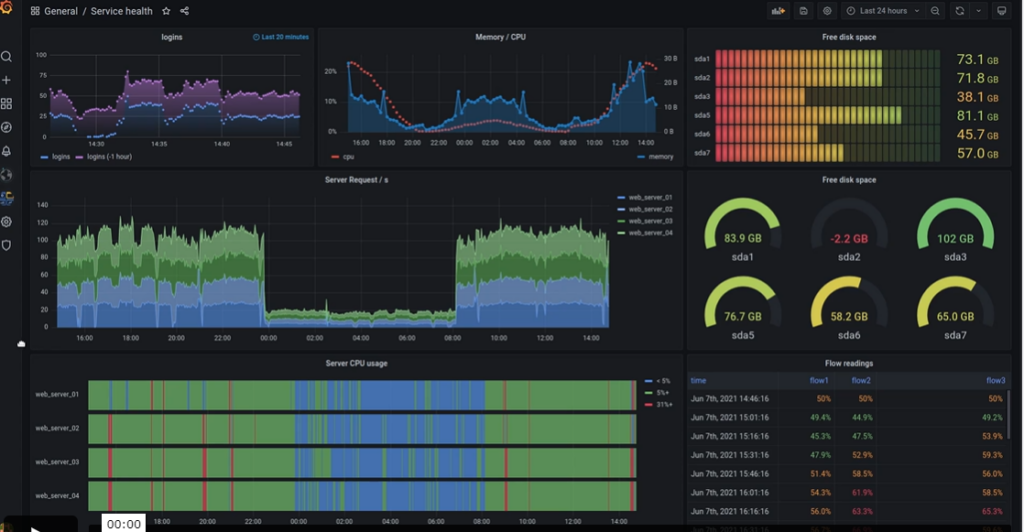 Taken from the official website Grafana.com
As a result, we coped with the task and showed quite good results of the program. The release went through, after the completion of the first marketing campaign, the number of active users grew to 8000. The program worked like clockwork, and the client and our team were satisfied with the work.
If you need to perform load testing, please contact [email protected]