The article will be useful for:
- Developers, systems engineers, analysts;
- Managers who use or only plan to use SLO;
- All interested in real-time data analysis and monitoring.
In this article, I would like to focus on the following issues:
- Who needs SLO and for what;
- How (not) cheap is Application Performance Monitoring (APM) & Site Reliability Engineering (SRE);
- Why do SREs with the SLO concept become so “hype”;
- How the modern business world is reaping the first fruits of this tool;
- Ways of theoretical and practical implementation of SLO.
There is also a bonus for readers:
- Mathematics behind SLO;
- Correct and not very correct concept for SLO / SLI / SLA;
- How-to for making performance monitoring computationally cheaper.
Over the past few years, more and more corporations and global vendors have begun to pay attention to the concept of Service level objectives, which is an important component in APM & SRE.
Why?
Research shows that many businesses have about 800 hours of service or site unavailability per year. That’s more than 15 hours a week – and the costs can be considerable.
In the future, we can take into account that the manufacturer in the Automotive industry is losing $ 22,000 per minute downtime. But if the cost of a small enterprise probably doesn’t come close to that, even the loss of a few hundred dollars an hour can have a significant impact on the bottom line.
That is why the key goal of APM / SRE is to provide managers, analysts, developers with the necessary information about the infrastructure, its “viability” and to measure the happiness of the product user.
But the most interesting and difficult question is whether it is possible to reduce the percentage of downtimes by identifying and monitoring SLO? Spoiler: yes and no.
Briefly about Service Level elements
Given the trend of exponential growth of Internet users and the amount of information in general, there is an urgent need to dispose of the same SRE / APM.
Google is considered to be the first to develop the concept of Site Reliability Engineering. SRE itself is defined as a discipline that includes aspects of software engineering and applies them to infrastructure and operational issues. The main goals are to create scalable and highly reliable software systems.
Accordingly, given the technological needs and the scale at which Alphabet Inc, which includes Google, operates, the need to implement the SRE concept becomes clearer and clearer.
An interesting and potentially integral part of monitoring performance is the practice of developing rather exotic and key elements of SLI> SLO> SLA.
It is on these components and elements that we will focus on in the article. After all, SRE is a fairly broad topic, so we will consider only this aspect related to the definition and calculation of Service Level elements.
Common to all these elements is the focus on service: application, system, infrastructure, and so on. But between them there is a clear branching and definition:
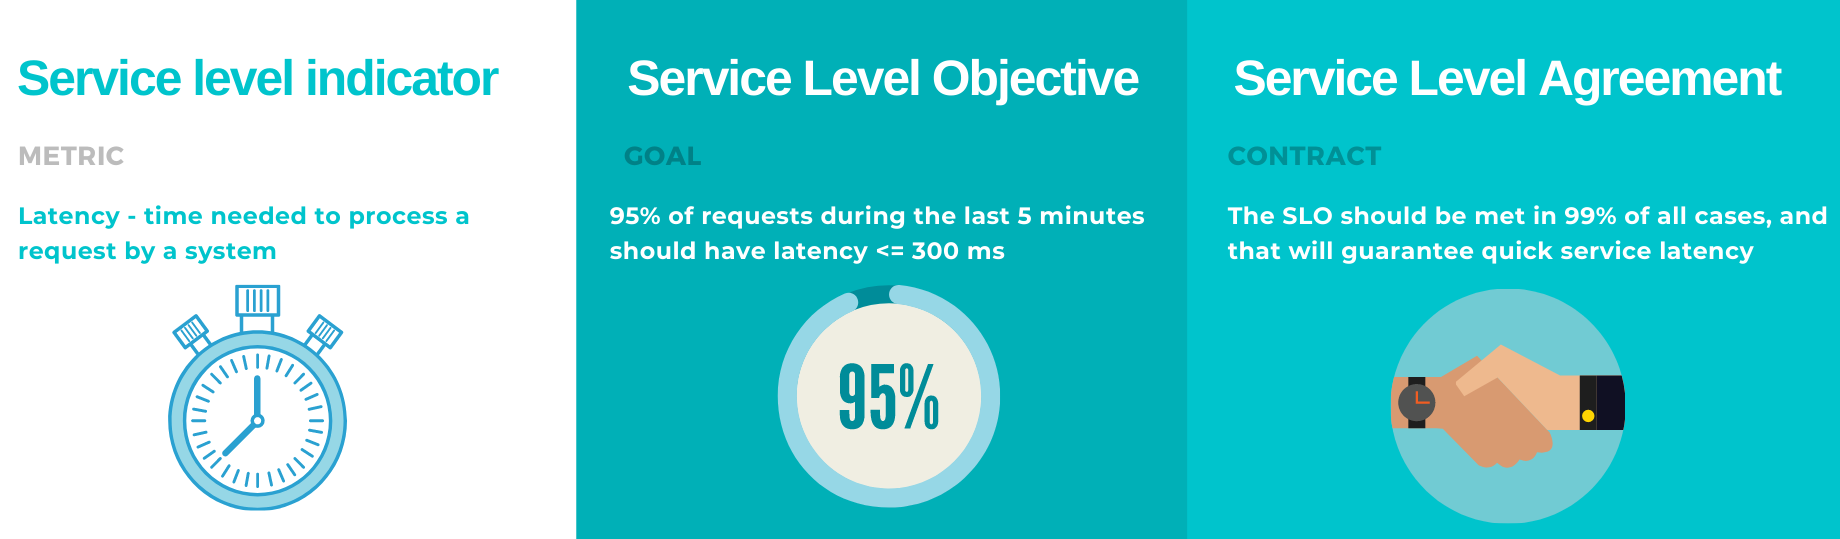
- Service Level Objective (SLO) – the goal to be met is based on an internal document, which defines the permissible limits and thresholds for specific indicators.
Example: 99.9% website reliability; - Service Level Indicator (SLI) is a metric used to calculate SLO. Example: Failure rate, Latency, Response time;
- Service Level Agreement (SLA) – an agreement on what service we promise to provide to users. Example: 99% service availability.
At first glance, SLO and SLA are quite similar, however, SLA is usually a weaker target than SLO. This can be expressed in the following purpose: for example, SLA on availability 99.9% within 1 month, while internal SLO availability 99.95%. An SLA is usually a promise we make to product users.
Keep in mind that SLO is about time and usually answers the following questions: What percentage of time X was able to meet the Y threshold of the Z indicator?
Short-term SLOs are important for developers, SRE teams, while long-term SLOs are important for managing organizations, reviewing goals, and more.
For example, if you set 99.9% SLO, then the total time it can be violated is as follows:
- Within 30 days – 43 minutes;
- Within 90 days – 129 minutes.
SLI answers the question: What metrics are monitored? What is observed?
The practice of monitoring SLI / SLO / SLA together is a means of incident management. Thus, thanks to SLO, these same incidents become predictable and much easier to manage.
Apparently, most of us have heard of the popularity of counting the number of days without accidents in large factories. This is somewhat similar to SLO, only here we determine the budget of time and money that can be allowed for these incidents that are critical to the business: downtimes, errors, slowness, transaction timeouts, and so on.
Therefore, SLO is an opportunity to reduce the number of incidents> make users happy> increase the number of customers and profits> ensure the reliability + availability of the infrastructure.
“Hype” around SLO and typical use-cases
SLO is a fairly popular trend today, and the good news is that businesses of all sizes are excited about it. Why?
- This serves as a so-called motivating factor that allows you to set a goal, achieve, increase the bar and achieve it again;
- You can measure the happiness of the end-user;
- Understand that any system is not perfect, and technical unavailability may be acceptable;
- SLO monitoring allows you to keep an eye on the pulse, to understand at what stage of infrastructure improvement we are now to improve performance in the future;
- SLO can be monitored in real-time, and there are more than enough tools for this on the market.
“We will achieve 99.99% reliability of the website and double the profits twice” – quotes from successful people who already use SLO.
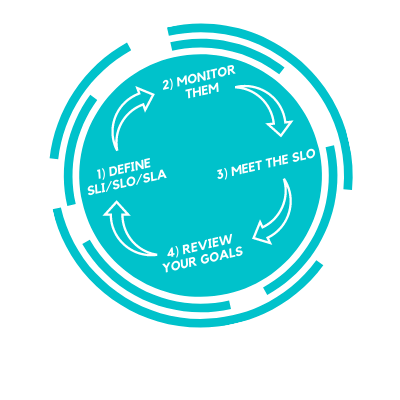
Implementation of monitoring for SLO is a vicious circle that can be worked on forever and the first step is very important – to correctly determine SLI / SLO / SLA.
Suppose we have a weak infrastructure, but our expectations are high. We believe that it is able to cope with highly loaded tasks.
According to SLO, our system should be available 95% of the time, but the maximum we get is 50%.
The SRE team starts coding a lot, trying to figure out how to increase availability by + 45% in 1 night, but something goes wrong.
What’s the matter? Maybe we have bad engineers or magnetic storms putting pressure on the servers? I don’t think the problem may be that the goal is not realistic enough at the initial stage. Maybe you should try to raise the infrastructure by at least 5-10%, and only then move on. What about this?
The second stage requires Data-engineers who must consolidate data, metrics, logs into a single repository for further monitoring.
A team of analysts is being connected to develop interactive dashboards so that SLI / SLO / SLA can be monitored.
We all start working hard, allocate resources so that SLO is achieved and there is a “finally finish”.
Spoiler: it will not be, because …
The third stage will come.
It’s time for questions and analytics:
- Has performance and productivity improved?
- What has increased infrastructure availability given us?
- And who needs those SLOs?
- Has income increased?
- Are users happy?
If everyone (or 99.99%) is happy, we can implement the final stage
– review goals, use and monitor new SLIs, improve existing SLOs & SLAs, and return to the first phase.
Tools for SLO
If you pay attention to the trends of vendors and products that offer monitoring solutions, it is not difficult to see that in most of them the ability to identify and monitor SLO is included by default or in the premium package. The most common, offering ready-made solutions include:
- New Relic;
- Splunk;
- Datadog;
- AppDynamics;
- Smartbear.
There are a lot of tools on the market today, but remember that this is just a tool, and how we achieve results is up to us.
It becomes obvious that there are no restrictions for building SRE monitoring and you can use whatever you want. In the case of a large enterprise that can afford a flexible and large-scale solution, there is Splunk / New Relic. If you do not have enough money, but want to try that SRE, you should pay attention to open-source (Grafana, Elasticsearch, jssonnet). The main thing is the desire and a little time to implement the solution.
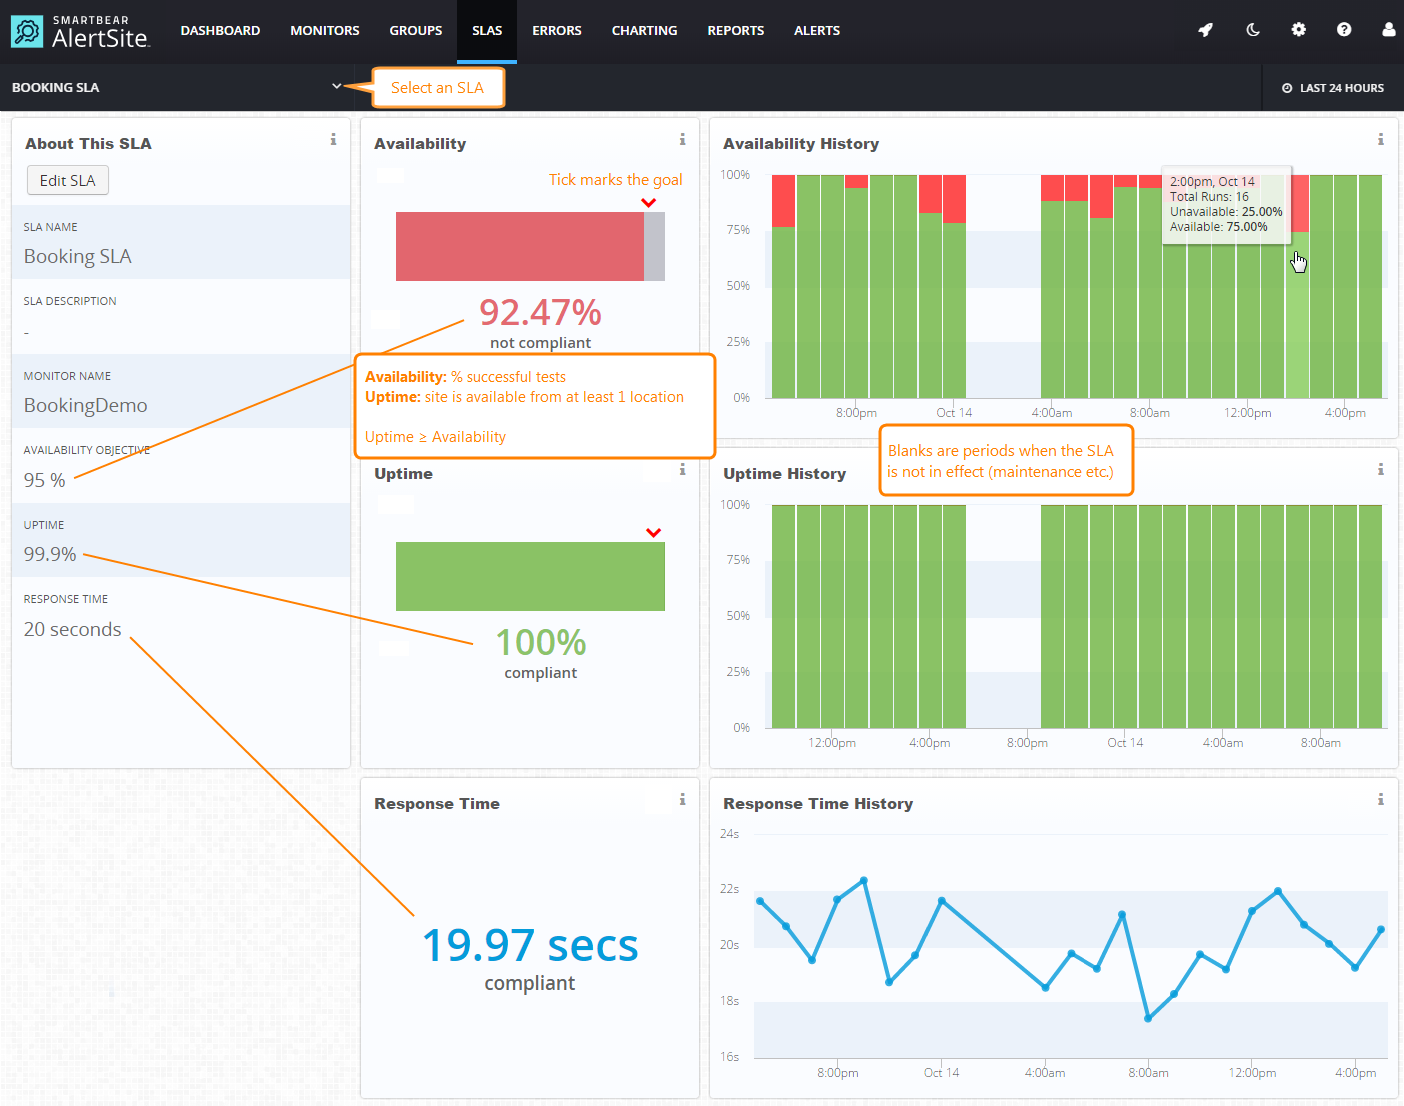
SLO dashboard in the Smartbear service
Using cool tools, where all calculations take place in the background and the user requires almost nothing – sounds quite attractive.
That is why many solutions for SLI / SLO / SLA needs are open-source. A good combination can be considered Elasticsearch, Logstash, Kibana (ELK Stack), which will provide many opportunities.
In addition, Prometheus as a metric collection tool, and Grafana for visualization is also a good alternative.
Anyway, even with the help of R-dashboards or Python you can monitor various indicators. It all depends on the availability of resources, budget and expectations. Taking these factors into account, you can choose the best tool for a particular business problem.
What can be calculated for SLO monitoring?
Metrics, KPIs, Indicators
Once you have decided on the tool we will use, we should move on to data collection and analytics.
Obviously, in order to monitor, there must be a set of metrics by which we can assess the quality of systems and applications.
There are Service Level Indicators for this. They can be traditional (CPU / Memory Usage, Latency) and custom. In my experience, there have been cases where you need to develop an indicator that will be very specific to a particular application and then it will be more useful than any traditional metric. A study of data conducted the needs of the customer and various specific metrics were offered in that case. It is thanks to this indicator that observability was improved by about 24%.
And the greatest value SLO brings in monitoring Availability and Reliability. These are key metrics, but not the only ones.
Warning! Both metrics are very important, but different, because certain equipment may be available but not reliable.
For example, a server that crashes for 6 minutes every hour. This means 90% availability, but less than 1 hour of reliability, which is not great.
Availability – the percentage of time the system is active and running, compared to the total scheduled operating time. Formula:
Availability (%) = (Active time / Expected operating time) x 100%
The expected operating time of the service is 24 hours a day, but for objective reasons – it works only 23 hours. Thus Availability is 95.83%.
Reliability or reliability quantifies the probability of active operation of the infrastructure for its intended purpose without interruption or error, can be measured as duration, and in the form of probabilities or percentages.
Reliability = Total uptime / Number of breakdowns
Reliability correlates with another metric – MTBF (Mean Time Between Failures).
Assume that the server has been running for 10 hours in 10 days, during which time it has been unavailable twice. After 25 hours of operation, it was repaired in 3 hours, after which it was available again for 22 hours (almost a day!) And again an error occurred, due to which the server lay for another 4 hours. Everything fell into place and the server worked for another 46 hours.
MTBF = (25 hours + 22 hours + 46 hours) / 2 errors = 93 hours / 2 errors = 46.5 hours.

Also key are metrics like Success & Failure rates, which show the percentage of successful or unsuccessful requests.
Duration monitoring
An indicator such as Latency is considered to be quite common and important – the time it takes to process a request. Accordingly, Latency can also be successfully used as an SLO.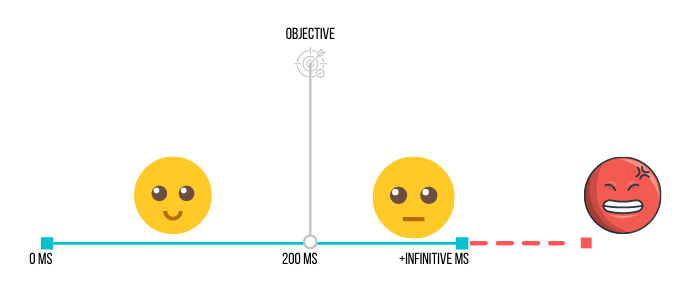
Latency indicates how long it takes the user to get the information he is requesting. And several questions arise at once:
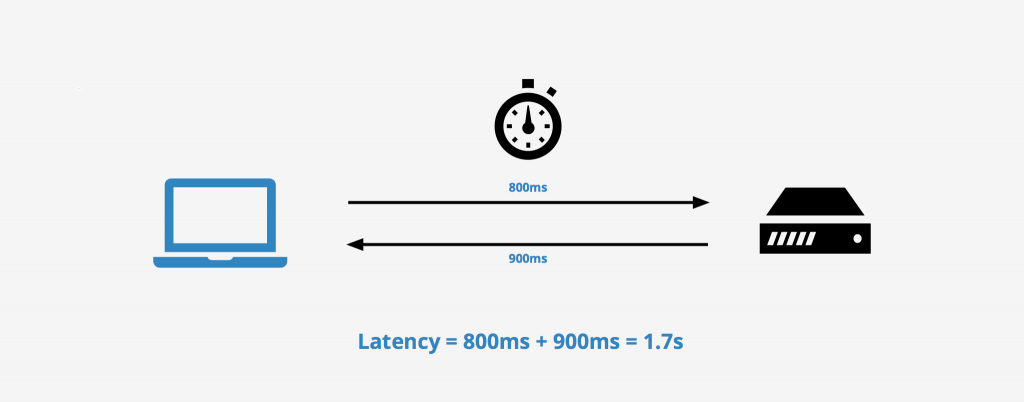
1. What is the beginning of the query and what is the end to get latency?
Many sources may have different definitions of Latency.
It is believed that the beginning is the time when the user sent the request, and the end is the time when the user received a response from the server.
2. What if the problem is on the user side and not on the server side?
Client / Server-side errors are an important component that is determined in monitoring using HTTP status codes, the study of logs.
It is recommended to collect a variety of SLIs that correlate with Latency: transaction time, backend time, etc., which allow you to determine how much
it takes time for the server or individual component to process the request. Thus, it is possible to obtain more information and monitor it better.
3. How to determine whether the Latency system is fast?
Find the ratio of queries where Latency is less than the set threshold and all queries. The result will be displayed as a percentage.
4. Is Latency effective as SLI in itself?
Quite effective, but can be improved by correlating with other metrics.
5. What else can I expect from Latency?
The value of this metric is that it allows you to determine the User satisfaction level or Apdex Score.
So, indicators that can be used quite a lot, if necessary, you can develop custom metrics to get more insights.
Various performance indicators of infrastructure and applications are important sources of information during the debugging and debugging of systems at the stage of testing and production.
Therefore, their monitoring and SLO calculation is quite important for highly loaded services.
Example of SLO calculation for 30 days
To calculate SLO you need:
- Metrics (SLI);
- Short-term goal (SLO);
- Long-term goal (SLO or SLA);
- Understanding the capabilities of the infrastructure.
In this example, the metric or SLI is Latency. Goals are SLOs that we develop for ourselves, the organization, and SLAs are goals that we promise to achieve for users.
Short-term goal – 95% of requests within 5 minutes must be less than or equal to 300 milliseconds.
Long-term goal – the short-term goal must be met in 99% of cases within 30 days.
This SLO calculation is not very cheap, as each request is compared in 5 minutes for 30 days. We’ll look at how to make this calculation cheaper later! 🙂
Define Error Budget
Let’s imagine a situation when we want not just to display SLO, its value in percent, but to see how many “tricks” or errors our system can allow.
There is a good approach to this with the use of Error Budget.
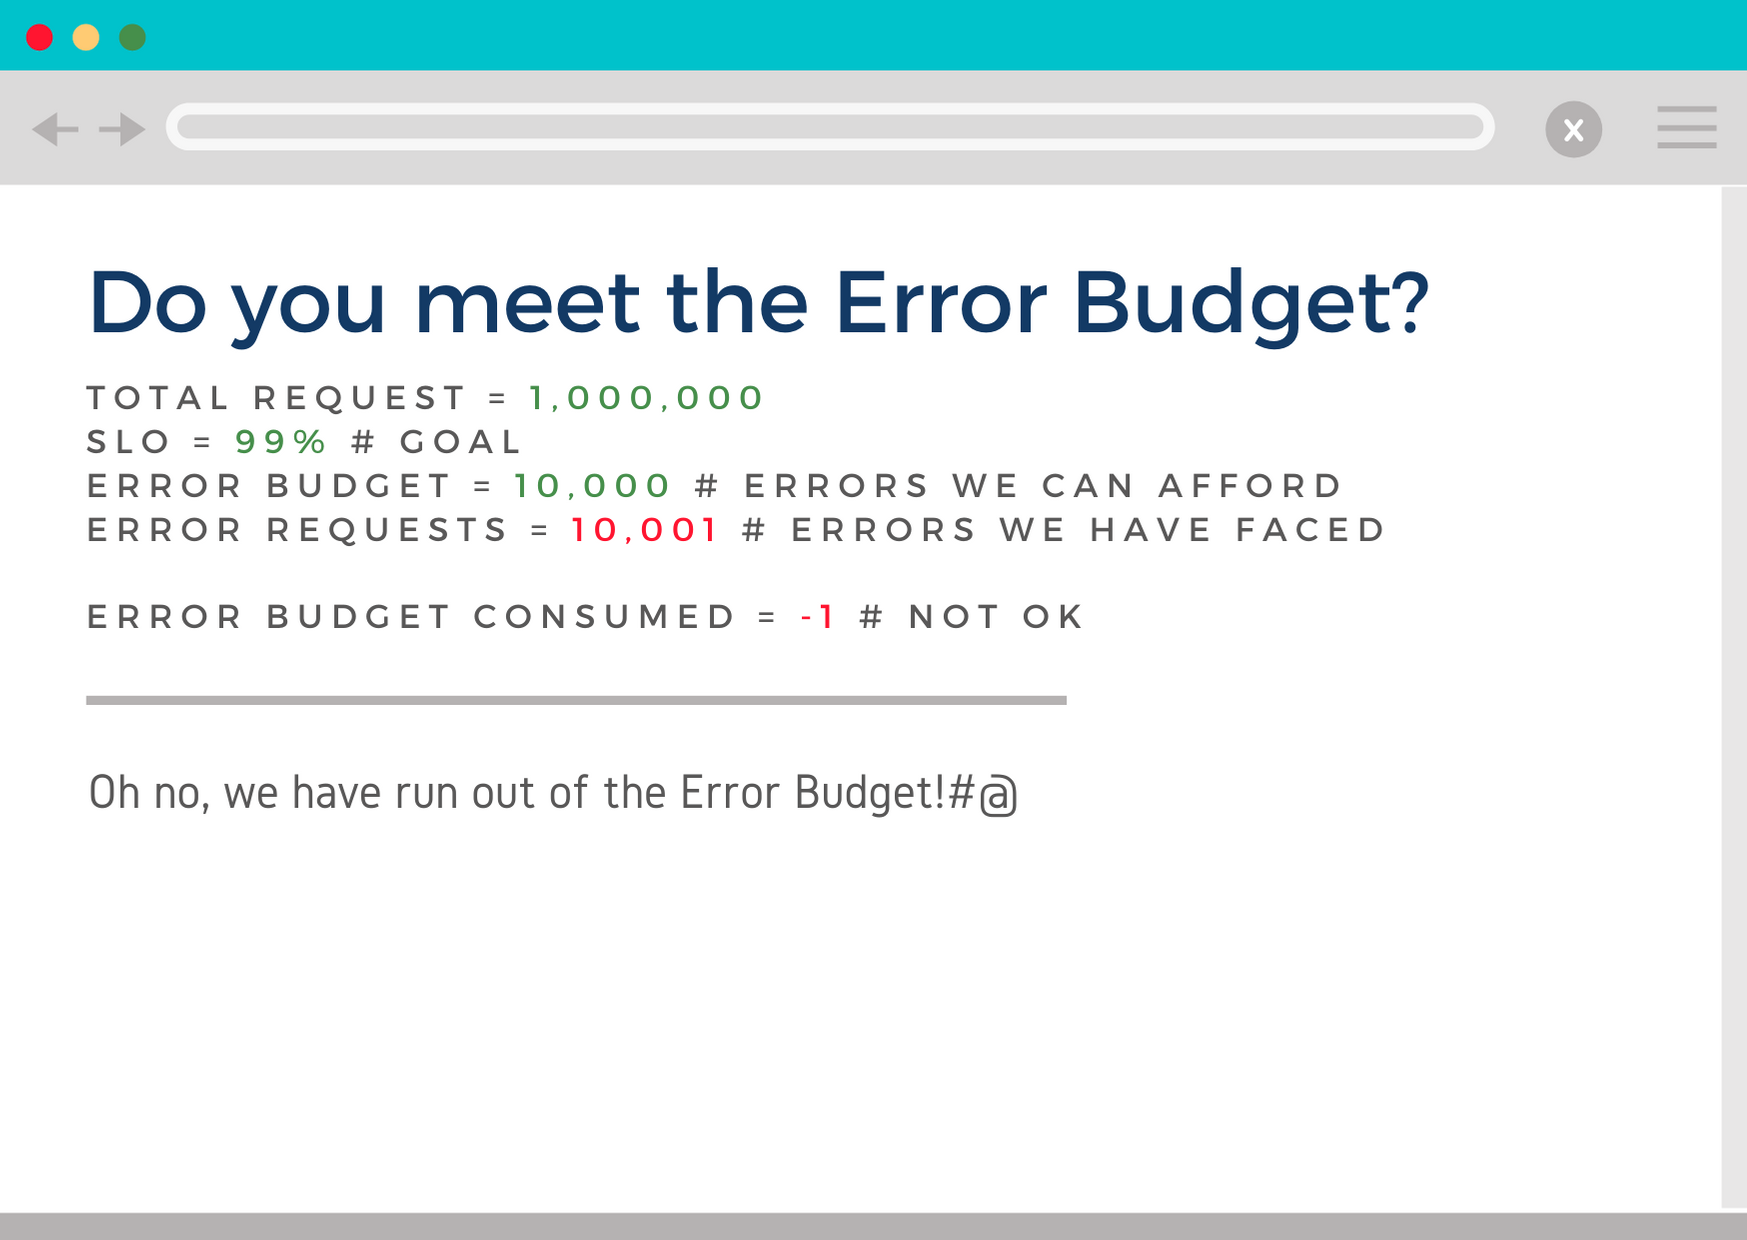
Each SLO has a separate Error Budget, which is defined as a 100% minus (-) target for a particular SLO. For example, there were 1,000,000 requests to the API server in the last week.
Success rate, according to SLO, should be 99%> 100% – 99% = 1% or 10,000 errors. Accordingly, this value reflects how many failed requests we can afford due to unavailable back-end, lack of connection to the server and other reasons.
Safe way for fast and cheap calculations
Data from the last 30 days are used for effective and informative SLOs. If at least 10,000 requests pass through the system per hour, then ~ 7.2 million are received per month. Quite a lot, especially when we find the median duration of the query for a 5-minute interval of 30 days.
And to this I will add a little more comparison operators and simple mathematical functions such as sum.
Processing each query on a single dashboard where there are multiple schedules becomes very expensive and slow.
As a solution, you can use the so-called summary indexes. In many APM tools, they are available and fairly easy to recycle.
For example, Prometheus is Recording Rules, and Splunk is called Summary Indexing (while there is also Accelerated data model), while ELK offers Data rollups.
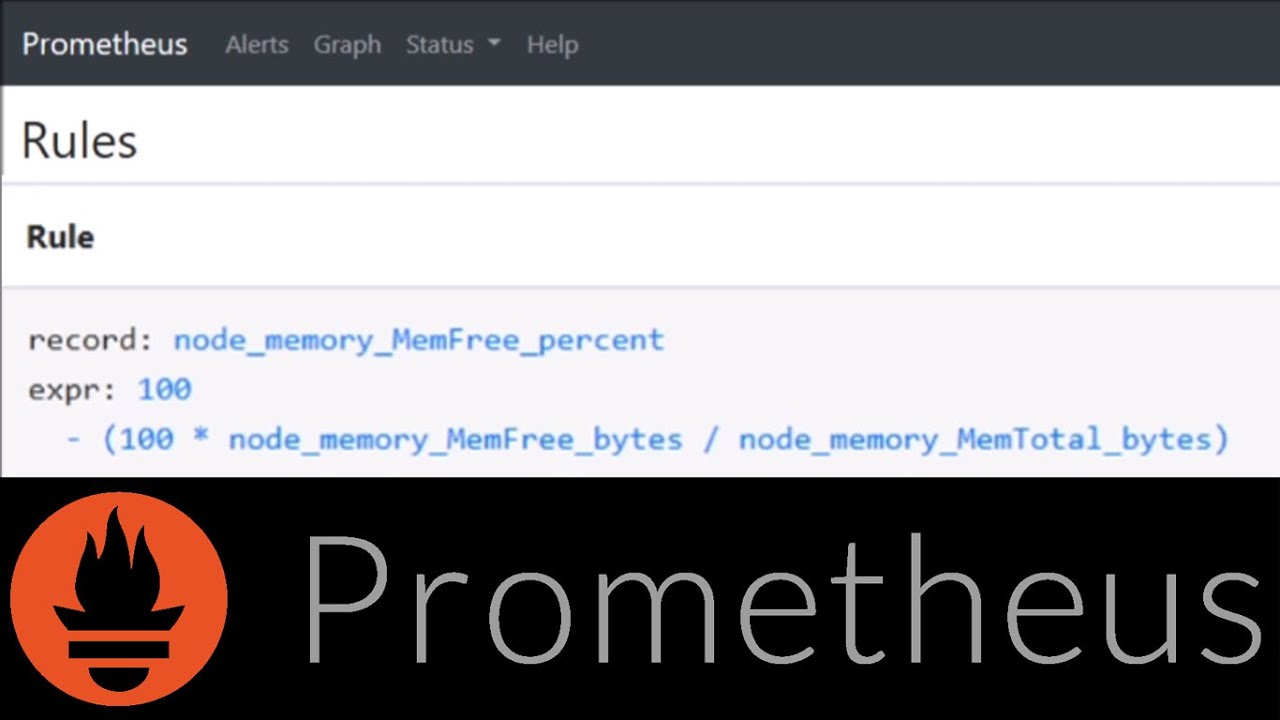
Final indexing allows you to quickly search large datasets, allocating the cost of a computationally expensive query.
A small subset of data is taken that is “injured” once at a set interval. The result is already stored as metadata or aggregation.
The algorithm is simple:
- Develop a query with the necessary metrics for SLO-calculations;
- Set the interval how often the metric should be calculated;
- Use only aggregate value;
- Enjoy the result.
Conclusions
The charms of using SLO
Service Level Objectives is a tool that, when used properly, can :
- Increase the availability and reliability of infrastructure;
- Make end users of the product happier and understand their needs;
- Create an incentive for continuous improvement;
- Improve the efficiency of development processes;
- Establish monitoring to gain as much insight as possible.
And further, SLO is an easy-to-use tool, its implementation is interesting as well as useful because:
- easier to manage infrastructure risks;
- realistically evaluate the performance of certain applications;
- ensure mutual responsibility between team members.
Disadvantages of SLO
A significant disadvantage of SLO can be excessive focus on certain metrics and indicators, and complete or partial indifference to others, no less important.
For example, imagine a restaurant that is always open, but has terrible food and service. That is:
availability = 100%, user satisfaction = 0%
Or someone who offers great food and a high level of service, but is only open for one hour, once a week. Again:
Availability = 0.5% (1 hour / 24 hours * 7 days), user-satisfaction = 99%
None of them is optimal.
If we don’t follow our SLOs and SLAs carefully, we can either put ourselves at undue risk or make empty promises to our customers and users, which doesn’t really mean anything.
The real path to success is to establish quality SLA practices and adhere to them.
Apparently, we expect that companies that offer high-performance services and products, such as Google, Netflix, Gmail, AWS or Facebook, have a goal – 100% Availability and successfully adhere to them. However, no properly defined SLO can be satisfied all the time.
An adequately defined goal for an online service is always less than 100%.
We are seeing how old infrastructure is changing and new infrastructure solutions are being developed, as the availability and reliability of business sites becomes almost linear with revenue and profits.
However, SLO is not something you can create and forget. According to Storage Switzerland, within 10 years of application, 60% of Service-level objectives remain unchanged, 25% – require minor modifications, while 15% require significant improvement and revision.
Service level objectives for the business are:
- the ability to set internal goals for a strong and reliable infrastructure;
- gain the trust of customers and users;
- create a strong motivating factor for further improvement of the system / application / service.
The most important thing is to collect the necessary metrics, competently define goals and ensure their implementation to users.
Services Need SLOs