In the modern world, software development has become an integral part of business processes, requiring not only high productivity, but also reliable protection against security threats. In this context, DevSecOps acts as a key paradigm, integrating security principles directly into the development and delivery processes. Particular attention is paid to tools that help ensure application security at every stage of their lifecycle. In this article, we’ll focus on the combination of two powerful technologies—Kubernetes and SonarQube—and look at how using them together as part of DevSecOps helps create reliable and secure solutions.
SonarQube is a powerful static code analysis tool that is being actively implemented in DevSecOps practices to ensure high levels of software security and quality. This tool is designed to identify potential vulnerabilities, code defects, and performance issues early in development.
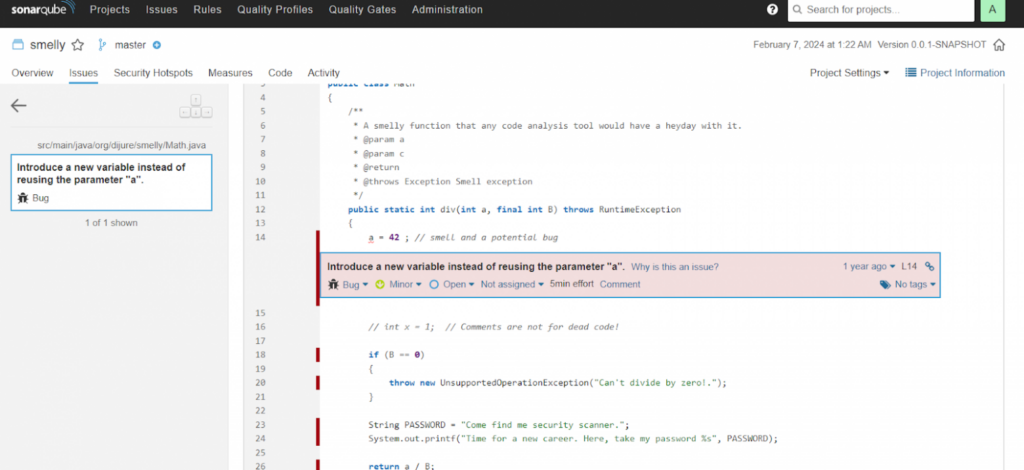
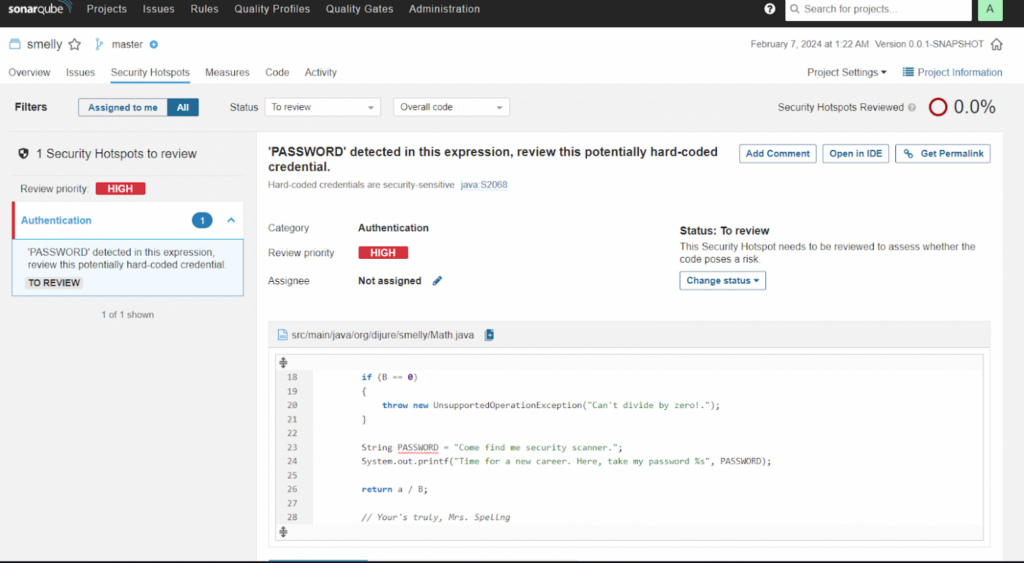
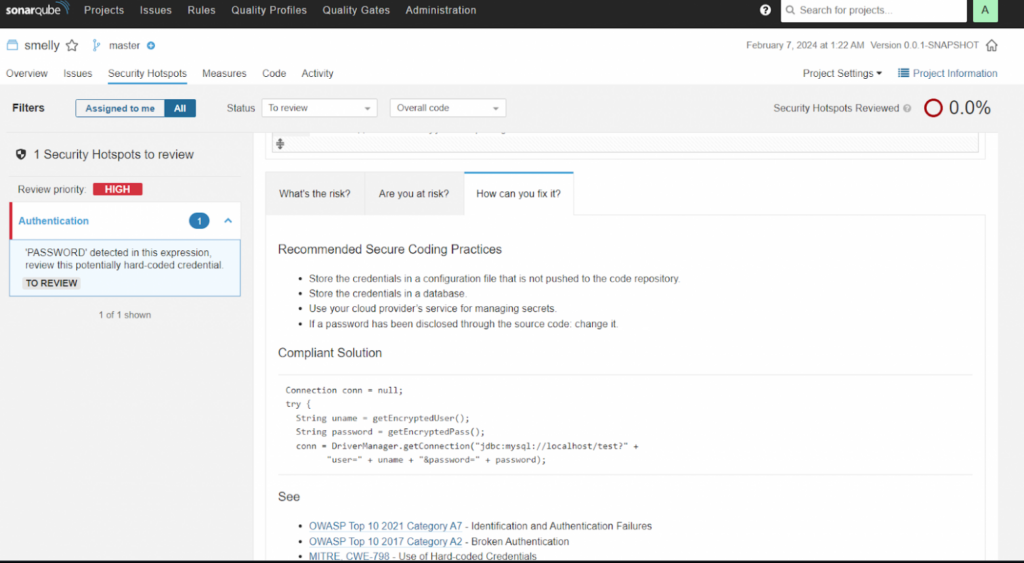
One of SonarQube’s key benefits is its ability to perform automated code analysis across multiple programming languages. Integrated static analyzers allow you to identify problems such as incorrect use of authentication, leaks of confidential information, potential security vulnerabilities and other aspects affecting the security of the application.
However, SonarQube is not limited to just security. It also provides developers with valuable insights into code quality by supporting a variety of metrics such as cyclomatic complexity, code test coverage, code reuse rate, and others.
Let’s get started
We will need Helm to install Sonarqube on the cluster
helm repo add sonarqube https://SonarSource.github.io/helm-chart-sonarqube && helm repo list
Let’s deploy
helm install my-sonarqube sonarqube/sonarqube \
  --version $VERSION \
  --namespace sonarqube \
  --create-namespace \
  --values sonarqube-values.yaml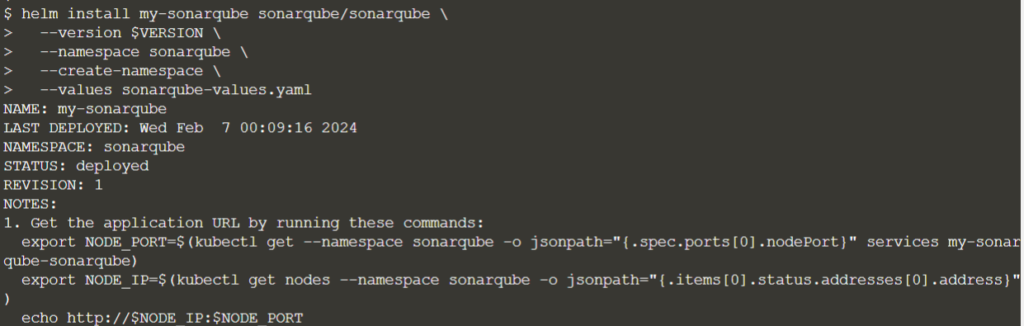
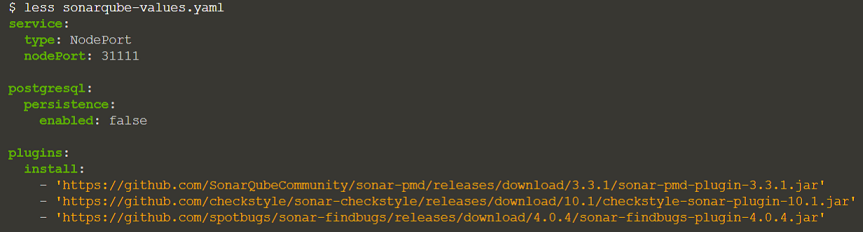
This dataset automatically initializes the SonarQube instance along with the PostgreSQL database. SonarQube also loads several useful analysis plugins defined in the Helm chart configuration:
Let’s check if everything is deployed
watch kubectl get statefulset,pods,services --namespace sonarqube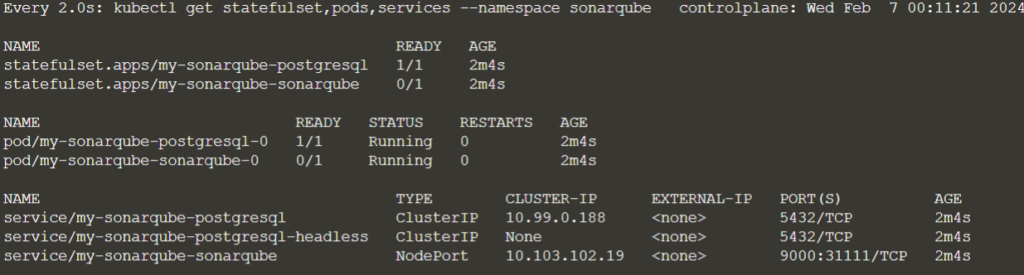
The SonarQube service is opened as NodePort on port – 31111.
to READY 1/1 state, and it may take another minute or two before the working instrumentation is available.
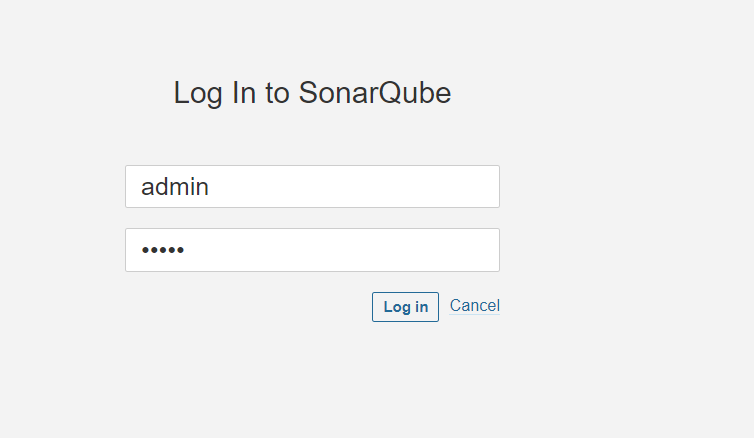
We can login as admin/admin and view the pre-installed selected plugins.
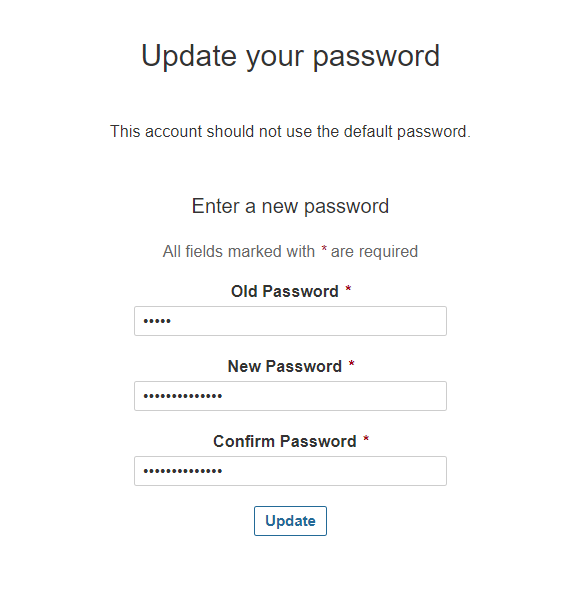
Let’s change the password to a very secure 123 (Of course a joke)
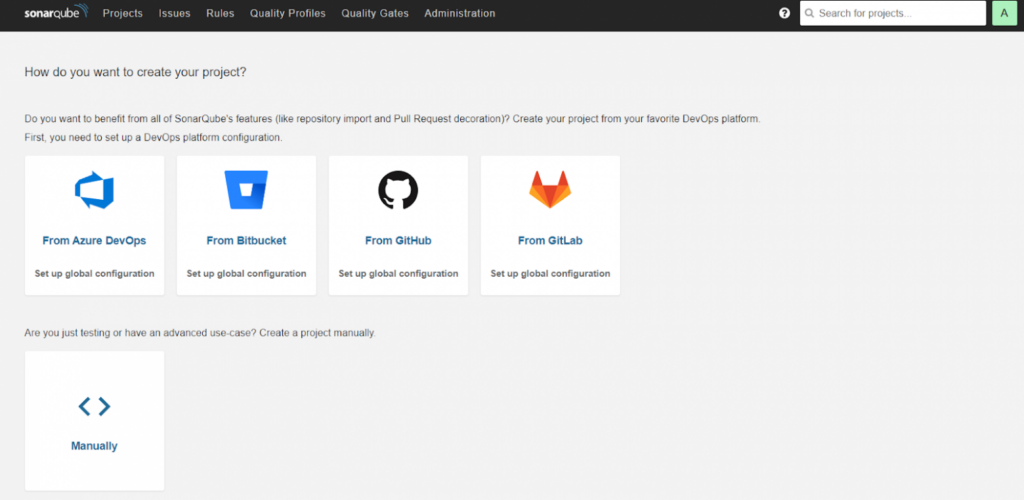
Project analysis using SonarQube
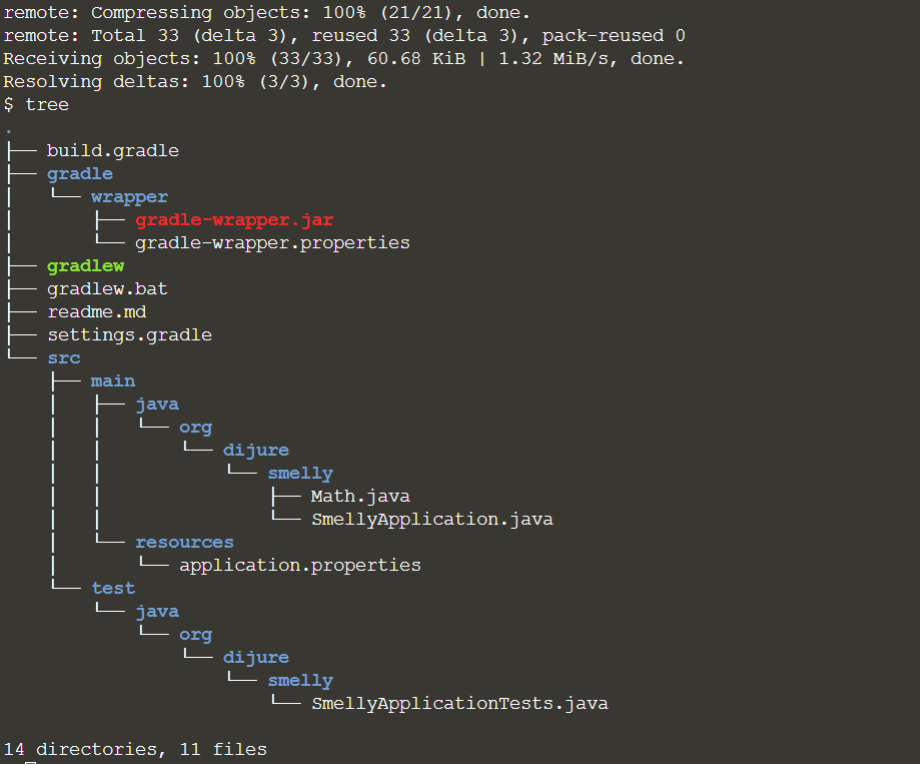
Let’s clone the sample repo:
git clone https://github.com/javajon/smelly && cd smellyThis project includes a microservice directory that contains a small Spring Boot application built using Gradle:
We analyze this Java project using SonarQube as the rules engine and dashboard where the results are published.
Let’s get the location of our SonarQube:
SONAR_SERVICE=https://sonarqube.qa.environments.ibm.comLet’s start the analysis
./gradlew -Dsonar.host.url=$SONAR_SERVICE -Dsonar.login=admin -Dsonar.password=12QA67wWbA. Sonarqube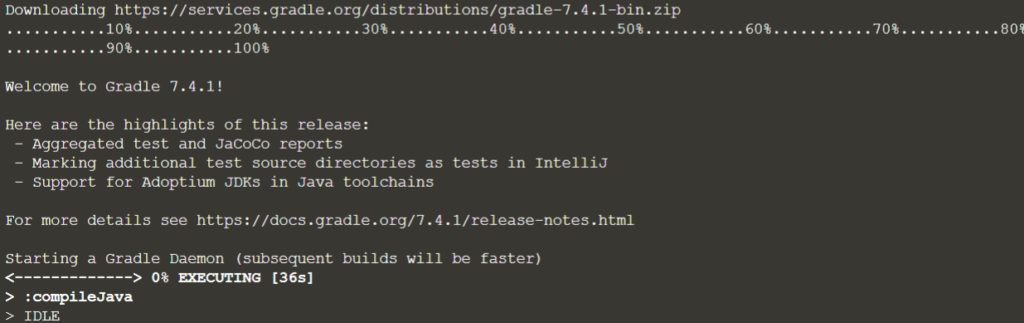
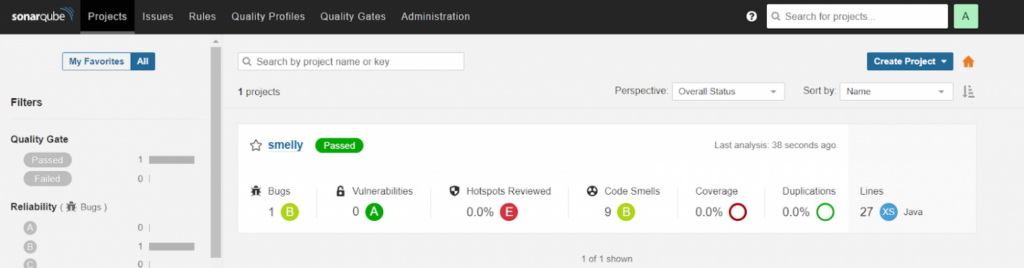
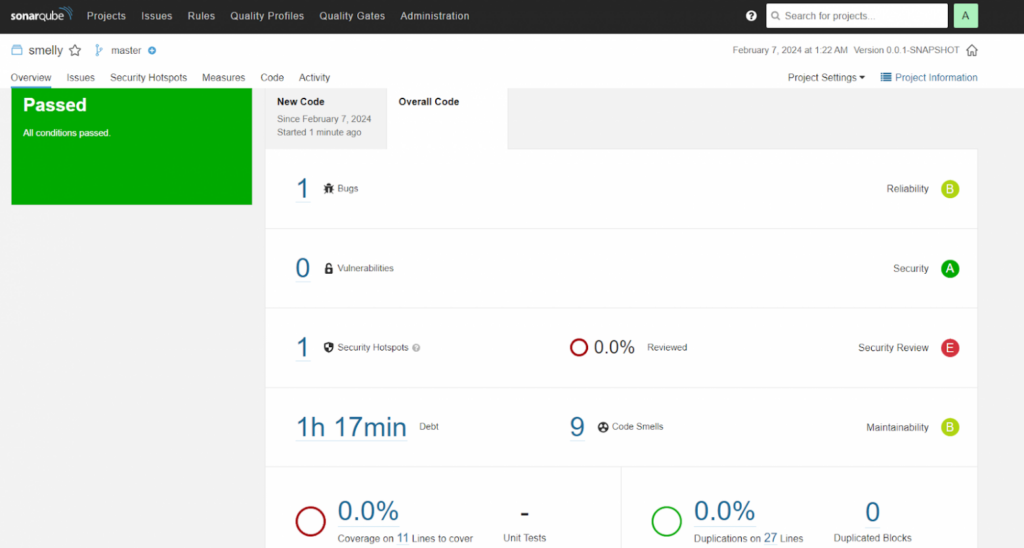
The analysis will take approximately 2 minutes to publish the results to SonarQube. Upon completion, we go to the SonarQube portal and observe the analyzed project.