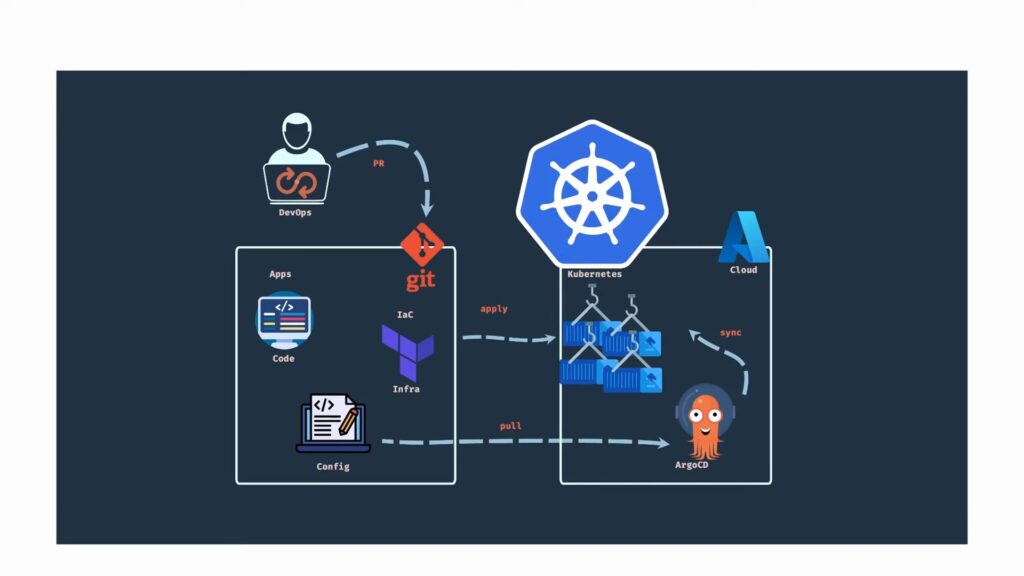
Kubernetes is an amazing tool for managing your applications. But let’s face it: security is serious business. In this article, we’ll dive into how to keep your Kubernetes cluster secure and monitor it for any sneaky vulnerabilities, security issues, or misconfigurations. In other words, we’ll deploy an open-source security scanner to handle these tasks automatically. And instead of running scans manually in the terminal, we’ll use another open-source tool to monitor and collect security metrics while building useful dashboards to visualize your security posture.
So, let’s get started!
Step 1: Set Up a Local Kubernetes Cluster with Minikube
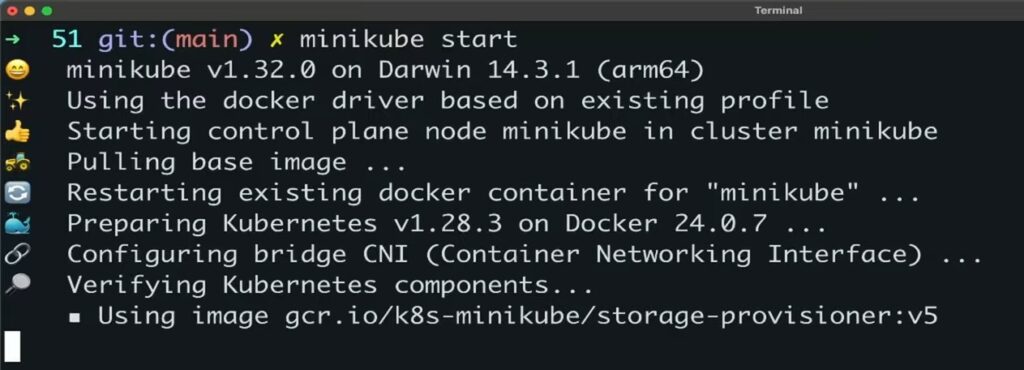
We begin by firing up a local Kubernetes cluster using Minikube. Minikube is a perfect tool for testing configurations before applying them to a real cluster.
minikube start
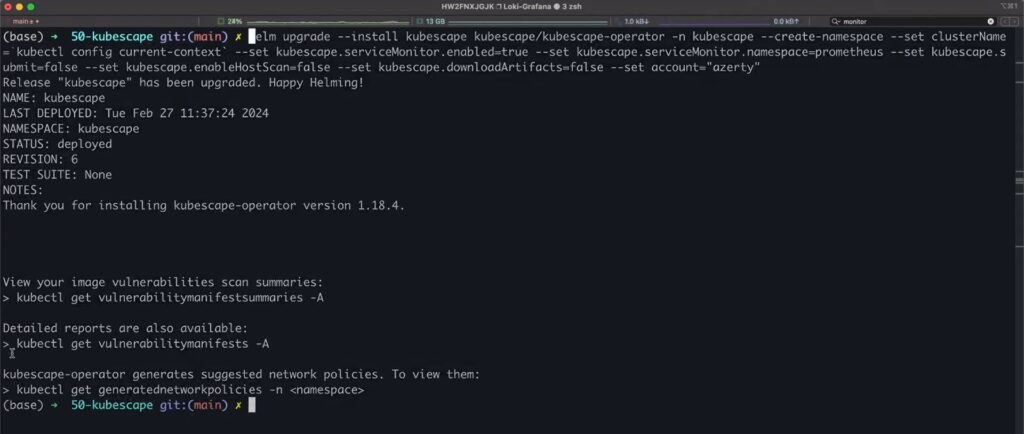
Step 2: Deploy the KubeScape Operator with Helm
Next, we use Helm to deploy the KubeScape operator. Helm simplifies the installation and management of Kubernetes applications.
helm repo add kubescape https://kubescape.github.io/helm-charts
helm install kubescape kubescape/kubescape-operator
 Why Security Metrics Matter
Security metrics provide visibility into potential vulnerabilities. Without them, you’re essentially flying blind. Metrics can tell you:
- Where your weaknesses lie
- How your security is trending over time
- Whether your security investments are paying off
Meet KubeScape
KubeScape is an open-source platform designed to enhance Kubernetes security. It scans your cluster for vulnerabilities and misconfigurations, evaluating your setup against security frameworks like NSA and MITRE.
To view security metrics, you can use kubectl in the command line. However, there’s a better way: monitoring with Grafana and Prometheus.
Step 3: Deploy the Monitoring Stack with Grafana and Prometheus
We’ll deploy a monitoring stack using Helm, just like we did with KubeScape.
helm repo add prometheus-community https://prometheus-community.github.io/helm-charts
helm install prometheus prometheus-community/kube-prometheus-stack

This stack includes everything we need to start monitoring our Kubernetes cluster, including KubeScape’s security findings.
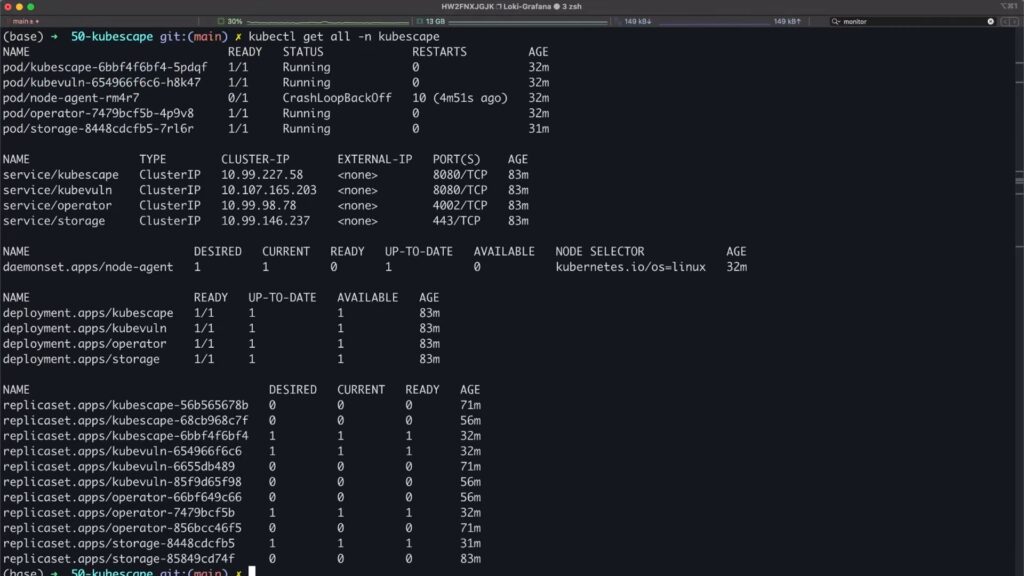
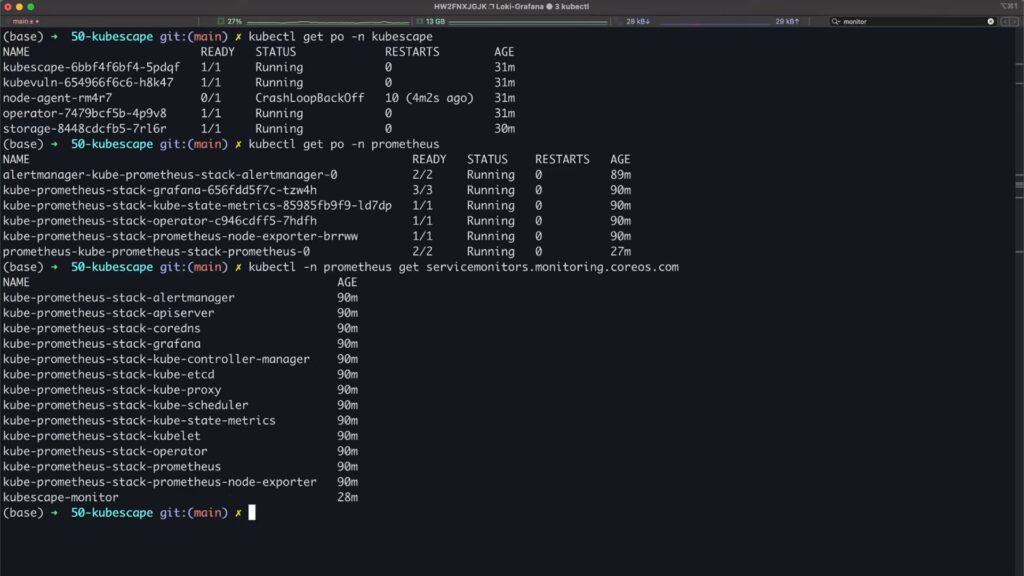
Verify Deployment
After deployment, make sure all pods and services are running:
kubectl get pods -n monitoring
kubectl get services -n monitoring
 Step 4: Visualize Metrics with Grafana Dashboards
Once the monitoring stack is ready, access the Grafana UI and navigate to the Explore tab. Here, you can check if KubeScape metrics are being collected by Prometheus and sent to Grafana.
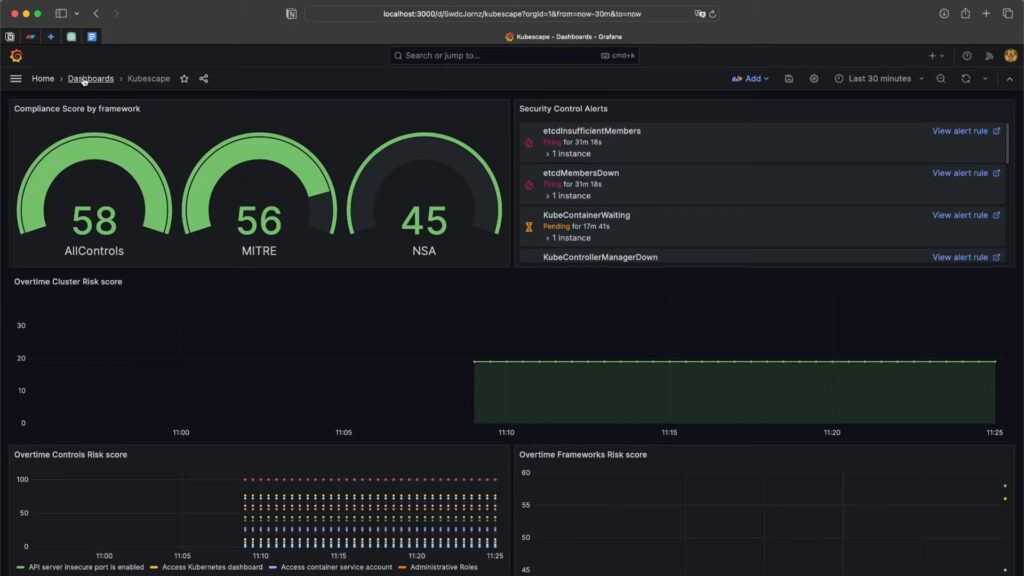
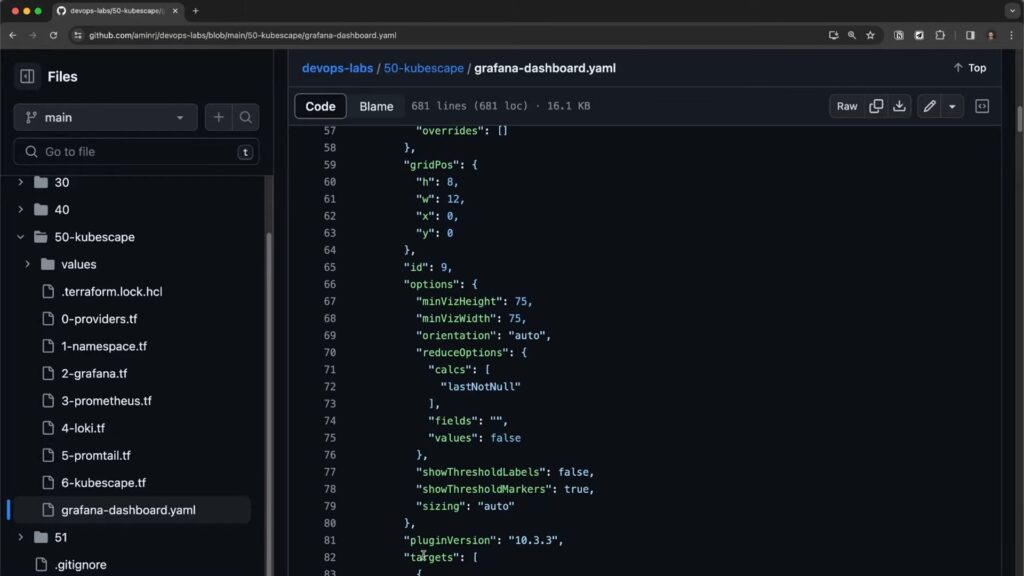
Create Your Dashboard
You can create dashboards from scratch using the available metrics or download a ready-to-use dashboard from this GitHub repository. Customize it to fit your needs!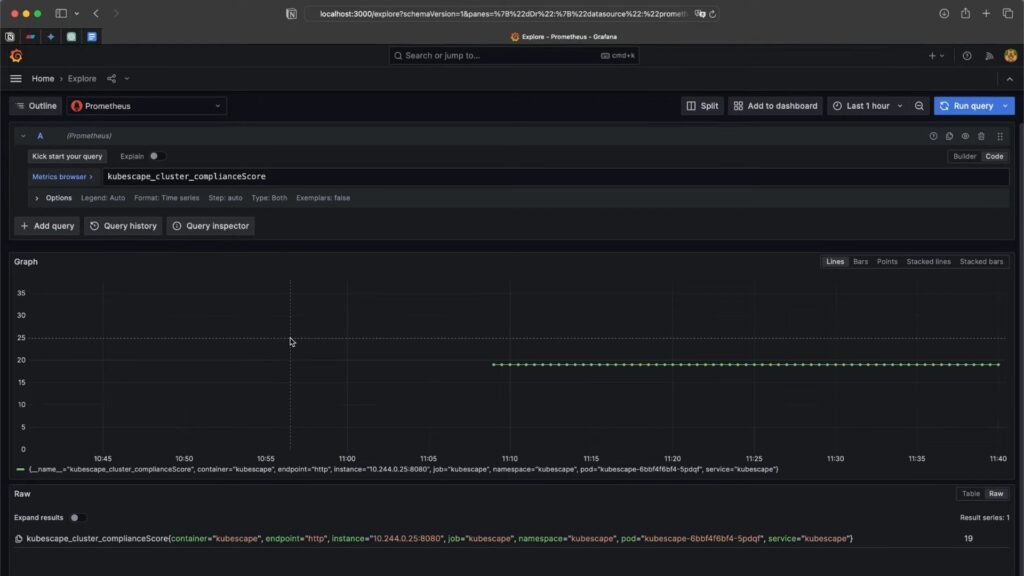
Conclusion
Securing your Kubernetes cluster is a journey, not a destination. By monitoring diligently and using the right tools like KubeScape, Prometheus, and Grafana, you can confidently steer your container ship through the often-choppy waters of cloud-native security.