In this article, we are going to discuss what observability is in DevOps and explore how it helps in maintaining, troubleshooting, and improving applications and systems.
What is Observability?
Observability is the ability to understand what’s happening inside your system based on the data it generates. In simple terms, observability is an enhanced version of monitoring. It helps identify the internal state of your system or application based on outputs like logs, metrics, and real-time traces. These outputs provide real-time insights into the application or systems, helping teams react promptly to issues.
A Simple Analogy
Imagine driving a car. You have a speedometer, a fuel gauge, and an engine indicator—all of which help you understand how the car is performing. Similarly, in DevOps, observability helps us monitor the performance of an application. If any issues occur, we can quickly troubleshoot and improve the overall performance.
The Three Pillars of Observability
Observability consists of three core pillars:
- Logs
Logs are detailed records of events that provide insight into specific occurrences. They help us understand what happened at a given point in time.
- Metrics
Metrics represent numerical data showing system performance. This includes data such as CPU usage, response time, and memory consumption. Metrics help determine how well the application is performing under different conditions.
- Traces
Traces show the journey of a request across various services. For example, when a user logs into an application, traces show the path the request takes from the frontend to the backend, and what happens at each stage.
With the help of logs, metrics, and traces, teams can identify problems, troubleshoot issues, and improve performance.
Why Is Observability Important in DevOps?
Observability plays a crucial role in modern DevOps environments for several reasons:
- Quickly Identifying and Fixing Failures
Unlike traditional monitoring tools that rely on predefined rules, observability provides a deeper and dynamic understanding of system behavior. This allows for faster identification of issues.
- Improving Performance and User Experience
By collecting real-time input data, observability enables you to see how users interact with the system and quickly detect performance bottlenecks.
- Reducing Downtime and Ensuring Smooth Deployments
With quicker insights into failures, observability reduces downtime and helps maintain smooth and stable deployments.
Example: Diagnosing a Slow Website
- Logs reveal system or application errors.
- Metrics show CPU or RAM usage, helping identify overloaded components.
- Traces pinpoint exactly where the request is being delayed.
This comprehensive visibility is the real power of observability.
Observability Tools in DevOps
There are various tools used in DevOps to enable observability:
- Prometheus – Metrics collection and monitoring
- Grafana – Visualization of metrics
- ELK Stack – Logs collection and analysis
- Jaeger – Distributed tracing
- Azure Monitor – For Azure cloud
- AWS CloudWatch – For AWS
- Datadog and New Relic – Cloud-based observability platforms
Introducing Middleware
Middleware is a full-stack cloud observability platform that collects telemetry data from frontend to backend. It is designed to help developers and organizations monitor, optimize, and streamline both applications and infrastructure.
Key Features of Middleware
- Infrastructure Monitoring
- Application Performance Monitoring (APM)
- Serverless Monitoring
- Container Monitoring (including Kubernetes)
Hands-On with Middleware and Azure Kubernetes Service (AKS)
In a real-world scenario, we can use Middleware to monitor a Kubernetes cluster deployed on Azure. Here’s how it’s done:
Step 1: Create an AKS Cluster on Azure
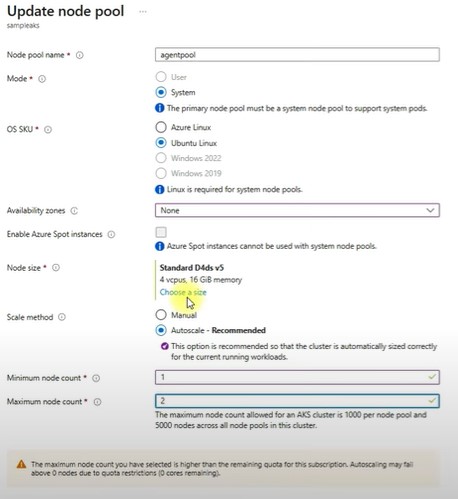
Start by setting up an AKS (Azure Kubernetes Service) cluster in your Azure portal. Select your resource group and name your cluster (e.g., sampleAKS). Adjust node count and size based on your requirements, and keep most settings default.
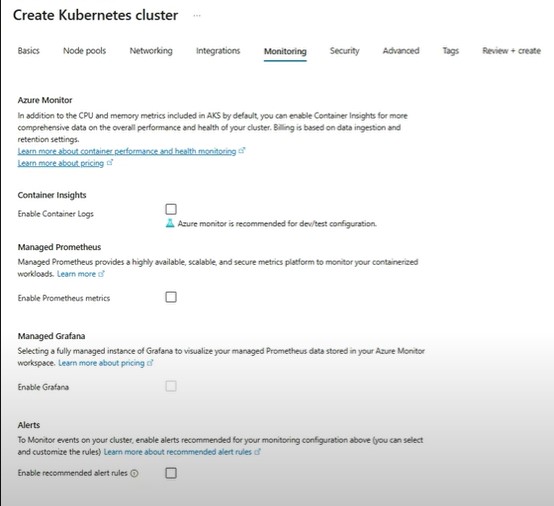
Note: Disable monitoring in Azure at this point because you’ll be using Middleware instead.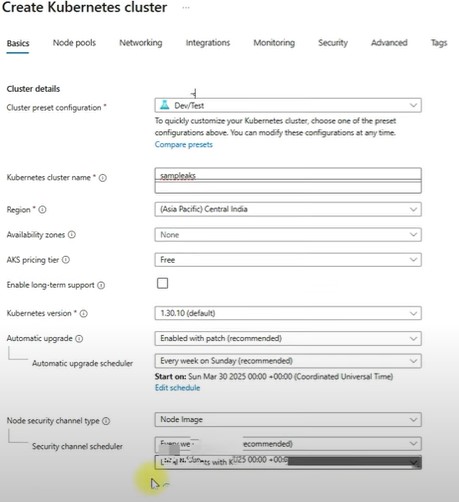
Step 2: Sign Up on Middleware Platform
Go to the Middleware platform and sign up using your Google or organization account. From the home tab, you’ll see various services:
- Infrastructure Monitoring for VMs
- Container Monitoring for Docker
- Kubernetes Monitoring (Clusters, Nodes, Namespaces, Pods)
- APM for applications
- Logs for all services
- Real User Monitoring (RUM)
- LLM Observability
- Custom Dashboards
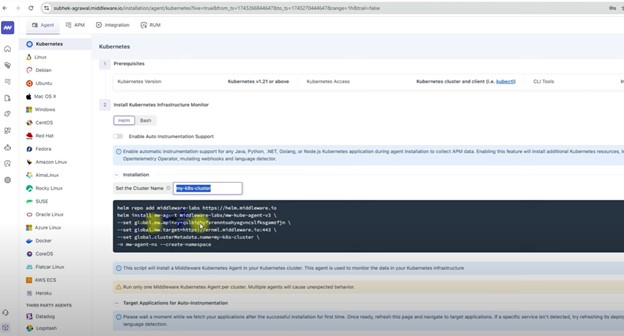
Step 3: Connect AKS to Middleware
Use the instructions provided by Middleware to:
- Enter your AKS cluster name.
- Run the generated script in your cluster using the Azure Portal’s “Run Command” feature.
This will install the Middleware agent in your cluster. Once deployed, it creates a dedicated namespace (mw-agent-ns) and starts monitoring your cluster.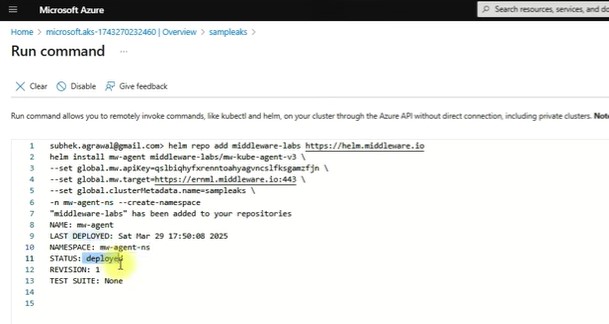
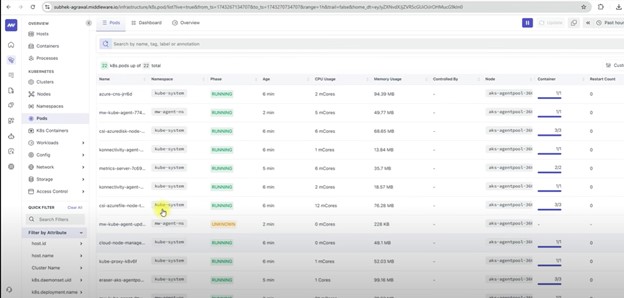
Step 4: View AKS Cluster Data
Once the agent is deployed:
- Check the dashboard for real-time metrics like CPU usage, memory usage, and pod status.
- See which pods are running or failed.
- Explore network settings and monitor services using internal IPs.
- Use APM and Logs tabs for performance and event logs.
- View events, namespace activity, and container behavior.
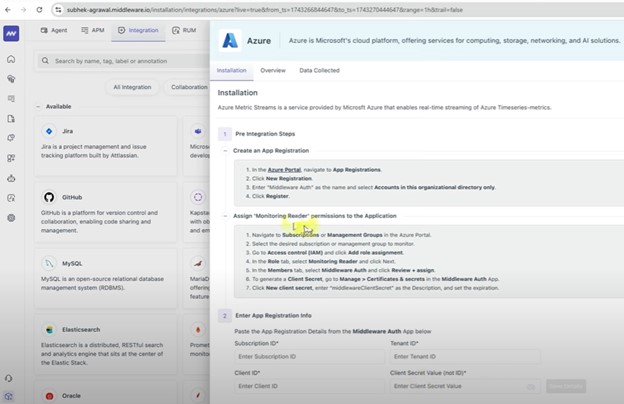
Cloud Integration
Middleware allows integration with multiple cloud providers. For Azure:
- Provide your subscription ID, tenant ID, client ID, and client secret.
- Save these details to begin monitoring all Azure resources from within Middleware.
Conclusion
Observability is a core concept in DevOps that goes far beyond traditional monitoring. It gives developers and operations teams the ability to see inside their systems in real time, identify issues proactively, and optimize performance across the stack.
Middleware offers a robust, developer-friendly platform for full-stack observability, supporting everything from infrastructure monitoring to application performance analysis across multi-cloud environments. Whether you’re working with AKS, AWS, Docker, or serverless architectures, Middleware provides comprehensive insights and powerful tools to streamline your operations and enhance reliability.