In this post, I will talk about monitoring – the process of collecting and analyzing information to make informed management decisions and achieve target targets. I’ll start with how much it costs different teams to dive into monitoring, remember the main methodologies and the two most important, in my opinion, metrics with which you can cover all (or almost all) cases.
Monitoring is one of the three parts of the Observability concept, which describes methods for gaining access to information about the internal state of the system. In addition to monitoring, the concept also includes logging and tracing.
Monitoring is often confused with logging, but these concepts are separated for a reason. When logging, we work with logs – a stream of events. And when monitoring, we collect, digitize and aggregate certain information necessary for decision-making. To complete the picture, let’s define tracing as monitoring the exchange of information between systems through requests using ServiceMesh or other tools.
I will give a simple example of monitoring. We have a database, and users say that it slows down. We are looking at the database monitoring results: approximately 1000 requests per second with an average response time of 2 seconds. Whether this is good or bad, we will be prompted by the destination indicators. Imagine that there is a response time of 1 second for 1000 requests. How to reach these figures? You can add hardware resources, optimize queries, do sharding, or come up with something else. Monitoring will also help us choose the best option.
Many IT systems are being implemented as a “black box”, so decisions about their further development are made on a whim, according to some kind of internal sensations. But whatever the IT system, monitoring can be envisaged in it. Globally, there are three major areas:
- Iron. Whatever clouds we use, they are always based on a hardware configuration that should be monitored for loading and other important parameters.
- Infrastructure. There can be many layers with their own sets of metrics – for example, a database, Kafka and other infrastructure services. For full monitoring, you need to consider them all.
- Applied Services. We write them ourselves and determine the metrics for them ourselves. They should be understandable to everyone, not just those who invented them.
The role of monitoring in teams
Devops and SRE should dive deep into monitoring. Their tasks include organizing and collecting metrics for hardware and infrastructure. They will not be able to work out the level of applied services in this way. For devops, this is a black box, which, at most, can be wrapped with standard services: for example, if it is an HTTP service, then standard metrics can be attached to it when balancing through nginx.
Developers should understand what hardware and infrastructure metrics are needed for their tasks. For example, you coded the system, everything went smoothly during load testing, but in the end nothing works. But there was a colleague who understands database metrics and helped to unwind the tangle: it turns out that you just forgot to optimize queries in the database, put indexes. Therefore, the indexes no longer fit into the RAM, the database had to crawl onto the disk and do full-table scans, and this led to a deplorable result. In addition to the ability to look, the ability to organize the normal collection of metrics in your code is also important – otherwise it will turn into a black box from the previous paragraph.
QA and support must understand the metrics of application services, and at deeper levels, you can turn to engineers. The same is true for product managers and product owners: everyone should understand butt metrics.
Monitoring Methods
Novice developers sometimes give in to monitoring tasks because they don’t know how to approach them. Next, I will briefly talk about three standard techniques that are worth highlighting – USE, RED and The Four Golden Signals. They help to clearly understand what and how to monitor.
USE stands for Utilization, Saturation, Error. USE is suitable for monitoring limited resources such as hardware. In general it looks like this:
- Utilization – work under load.
- Saturation – work under overload (tasks in the queue).
- Errors — the number of errors.
Let’s translate these USE metrics for the processor:
- Utilization. Here we may be interested in four processor time metrics: idle (how much the processor is not used), iowait (how long the processor waits for I / O), system (how much goes to the system), user (how much – to user tasks). Note that this metric cannot add up to more than the total amount of CPU time
- Saturation. LA (LoadAverage) – with the help of it, we evaluate how much a multi-core system is used. If this value is greater than the number of cores in the configuration, then the tasks are added to the backlog.
- errors. Cache misses – number of cache errors
Similarly, you can measure not only hardware resources, but in general any limited resources within an application, for example, buffers, caches, connection pools. In the latter case, the metrics will look something like this:
- Utilization: how many connections are allocated, how many are in use.
- Saturation: The number of pending connection requests. If there are 0 of them, then we most likely have free connections.
- Errors: how many times for various reasons we were unable to establish a connection.
RED stands for Rate, Errors, Duration. This is a very different method that works best in cases with unlimited resources, especially for applications in request-response mode:
- Rate – the number of requests to the resource per unit of time
- Errors – the number of requests per unit of time that ended in an error
- Duration – query execution time (in the form of a histogram)
The Four Golden Signals are not abbreviated to make them easier to remember. But in part, this technique also intersects with the previous ones. Four golden signals are recommended for use with the frontend:
- Latency – delays. It is important here to separate the latency of successful and unsuccessful requests; the latter can spoil the overall statistics.
- Traffic – system load. In web services, for example, it is usually measured in terms of HTTP requests per second.
- Errors — errors. Percentage of queries that failed for various reasons.
- Saturation – system load level. Particular attention here should be paid to resources that are limited. Also, the performance of some systems drops even before reaching full load, so it is worthwhile to determine the target level in advance.
Metric cuts
When creating metrics, it is important to consider their cuts – how they can be presented in aggregate for certain purposes. Let’s continue with the example of the RED methodology. In the case of HTTP requests, you can make cuts along a specific path, method, or response.
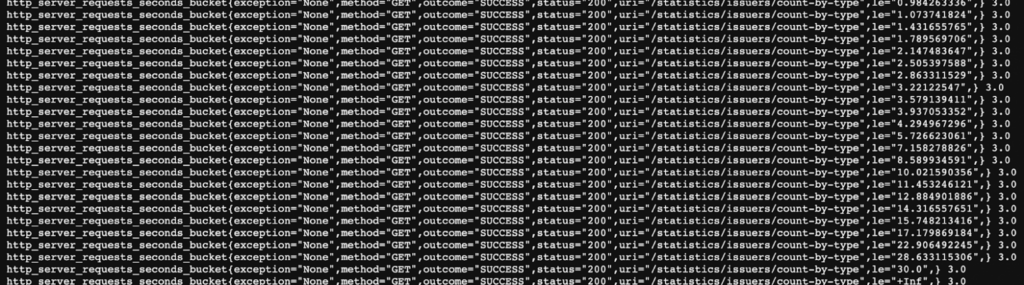
Above is an example of such a cut by exceptions, methods, statuses, and other parameters. What is not taken into account here? Time. Many times I have seen how developers try to extract timestamps during monitoring and conjure over them: collect average values, build graphs, some medians, and so on. You don’t need to do this. Histograms are provided for such tasks.
In the example above, the request time is measured by a monotonically increasing counter. A bunch of buckets are created with the tag “le” – less than or equal. Inside the bucket, there is a counter of requests that fall within the bucket interval. All requests that take more than 30 seconds fall into “le=+inf”. So we can not be tied to time, but immediately distribute requests. You don’t need to write this logic yourself: Micrometer, for example, has a separate timer class for this, similar tools are provided in JS, Grafana and many more.
The results are interpreted here as percentiles. For example, 99% of requests fall at one time, 95% at another, and so on. Usually four percentiles are sufficient to draw a conclusion about the system.
Once you discover the beauty of monitoring, it can be tempting to create as many metrics as possible. You should not get carried away here, because each metric will subsequently have to be supported and be able to interpret. For background jobs, it’s generally better to use the same tagged metric, such as job_rate{job = “send”} and job_rate{job = “receive”} . With the help of tags, it will be possible to dynamically configure Grafana dashboards here.
Great Universal Metric
Most of the monitoring tasks can be solved with a single metric – counter (monotonically growing counter). With the help of this counter, you can calculate a lot of things, for example, Rate is an increment per second. We can request it in any section we need, with different conditions.
Another great thing about this metric is that it can be added across different instances in a cluster. And the time histogram is essentially also a monotonically growing counter. In general, 90% of monitoring tasks can be solved using a monotonically growing counter. And tags, of course.
Second universal metric
Another universal metric is gauge, the value in the moment. This option is more suitable for business metrics and database values. Gauge is a very aggregated metric, it is difficult to divide it into tags, so you need to use it very carefully, with the same values for all instances in the cluster (for example, the number of records in the database).
Gauge solves those 10% of monitoring tasks that counter does not solve. For example, through gauge, you can display the current size of a queue, and with the help of counter, in the meantime, the number of messages read and written in this queue. This set will be enough to monitor any queue. Similarly, we can monitor the life cycle of any business processes.
What to monitor? Everything!
It happens that background processes are missed during monitoring, but monitoring them is very important. HTTP metrics can be taken from nginx, but task metrics will have to be done independently, since they are specific to the application. You can also use the metrics exported by, for example, Quartz.
I will also highlight the stages of business process execution. But if, for example, we have 20 types of requests and 30 statuses, we don’t need to create 600 metrics for this. Just count the transitions of requests between statuses through incremental counters, and then you can build any necessary reports.
It is important to monitor all external calls – you need to understand how long they answer us, how many requests, how many errors we get. Without this, you will have to endlessly analyze the logs. And of course, do not forget about the size of the queues – we analyzed them above.
When setting up monitoring, it is important not to reinvent the wheel. Everything you need is usually already available for free. Kafka can be monitored out of the box. HTTP servers and clients can also export metrics – you just need to connect them and display them. The same situation is with background processes.
Why is it important?
On average, any system is written 10%, and operated 90% of the time. The more people involved in working with it, the more time you need to devote to monitoring. With the help of metrics, developers will be able to quickly understand what is broken in production. And with the help of good metrics – also why it is broken. This is especially helpful with external integrations.
In distributed systems like blockchain, observability in general takes on even more importance (remember the term Observability from the beginning of the post?). Here we have many environments, many variables and options for what can go wrong. The time it takes to find a problem and all checks grows exponentially. Monitoring also helps to understand which points in the system are fragile, to digitize this “fragility” and system performance indicators.