RabbitMQ and third-party proxy
In one project for connecting cash registers is used Evotor cloud. In fact, it works as a proxy: POST requests from Evotor go directly to RabbitMQ – through the STOMP plugin implemented over WebSocket connections.
One of the developers made test requests using Postman and received the expected responses of 200 OK, however, requests through the cloud led to unexpected 405 Method Not Allowed.
The trained eye of an engineer immediately sees the difference:
curl: POST / api / queues /% 2Fclient ...

Evotor: POST / api / queues // client ...
The thing was that in one case appeared an incomprehensible (for RabbitMQ) // vhost, and in the other normally encoded -% 2Fvhost, which is the expected behavior when:
# rabbitmqctl list_vhosts

Listing vhosts ...

/ vhost
In the issue of the RabbitMQ project on this topic, the developer explains like this:
We will not be replacing% -encoding. It’s a standard way of URL path encoding and has been for ages. Assuming that% -encoding in HTTP-based tools will go away because of even the most popular framework assuming such URL paths are “malicious” is shortsighted and naive. Default virtual host name can be changed to any value (such as one that does not use slashes or any other characters that require% -encoding) and at least with the Pivotal BOSH release of RabbitMQ, the default virtual host is deleted at deployment time anyway .
The problem was solved without further involvement of our engineers (on the Evotor side after contacting them).
Genie in PostgreSQL
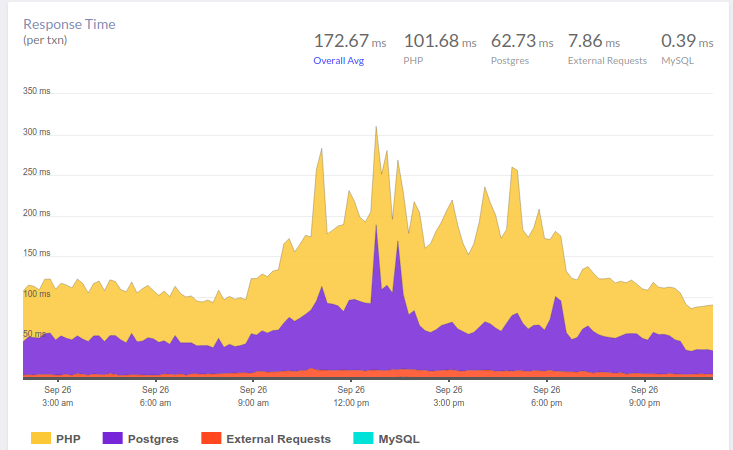
PostgreSQL has a very useful index, which is often forgotten. This story began with complaints about the pauses in the application. In a recent article, we already gave an example of an approximate workflow when analyzing such situations. And here our APM – Atatus – showed the following picture:

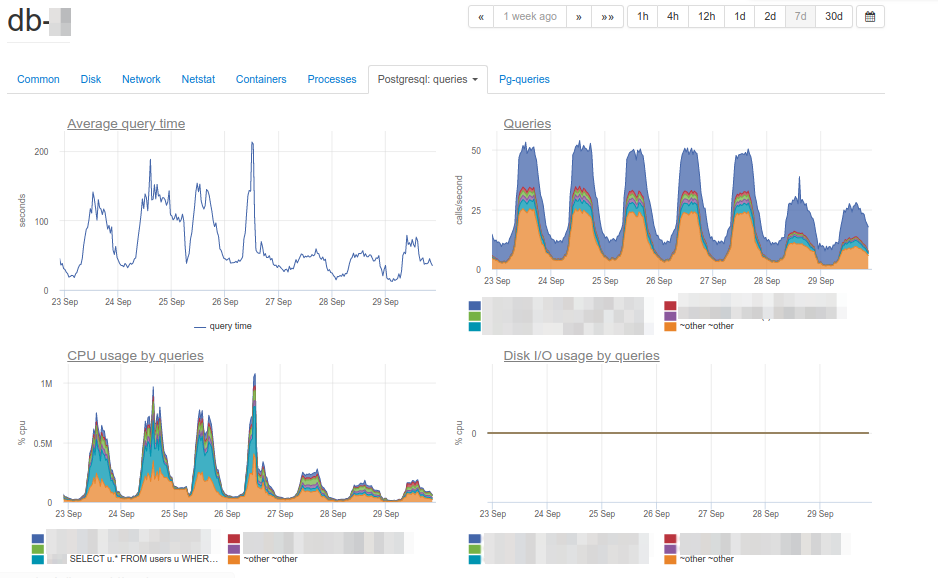
At 10 am, there is an increase in the time that the application spends on working with the database. As expected, the reason lies in the slow responses of the DBMS. For us, analyzing queries, identifying problem areas and “hanging” indexes is an understandable routine. The okmeter we use helps a lot in it: there are both standard panels for monitoring the status of servers, and the ability to quickly build our own – with the output of problematic metrics:

CPU load graphs indicate that one of the databases is 100% loaded. Why? The new PostgreSQL panels will prompt:

The cause of the problems is immediately visible – the main consumer of the CPU:
SELECT u. * FROM users u WHERE

  u.id =? & u.field_1 =? AND u.field_2 LIKE '% somestring%'

ORDER BY u.id DESC LIMIT?
Considering the work plan of a problematic query, we found that filtering by indexed fields of a table gives too large a selection: the database receives more than 70 thousand rows by id and field_1, and then searches for a substring among them. It turns out that LIKE on a substring iterates over a large amount of text data, which leads to a serious slowdown in query execution and an increase in CPU load.
Here you can rightly notice that an architectural problem is absolutely possible (here is required an application logic correction or even a full-text engine…), but there is no time for rework, and it should have worked quickly 15 minutes ago. In this case, the search word is actually an identifier (and why not in a separate field? ..), which produces units of lines. In fact, if we could compose an index on this text field, all the others would become unnecessary.
The final current solution is to add a GIN index for field_2. That’s the hero of the article – the same “genie”. In short, GIN is a kind of index that performs very well in full-text search, speeding it up qualitatively.

As you can see, this simple operation allowed to remove the extra load, and with it – and save money for the client.