We used to live in kvm virtual machines with CPU and memory limitations and, in case of moving to Docker, set similar restrictions in cgroups. And the first problem that we encountered was precisely CPU limits. I must say right away that this problem is no longer relevant for the latest versions of Java 8 and Java ≥ 10. If you update everything on time, you can safely skip this article.
So, we start a small service in the container and see that it produces a huge number of threads. Or the CPU consumes much more than expected and makes timeouts more than needed. Or here’s another real situation: on one machine the service starts normally, and on another, with the same settings, it crashes because of OOM killer.
The solution turns out to be very simple – just Java doesn’t see the limitations of –cpus set in the docker and believes that all the kernels of the host machine are accessible to it. And there can be a lot of them (in our standard setup – 80).
Libraries adjust the size of the thread pools to the number of available processors – from here comes the huge number of threads.
Java itself scales the number of GC threads in the same way, what leads to the CPU consumption and timeouts – the service starts spending a lot of resources on garbage collection, using the big amount of the quota allocated to it.
Also, libraries (in particular Netty) can, in certain cases, adjust the size of off-heap memory to the number of CPUs, which leads to a high probability of exceeding the limits set for the container when running on a more powerful hardware.
At first, as this problem manifested itself, we tried to use the following work rounds:
– tried to use a couple of services libnumcpus – a library that allows you to “trick” Java by setting a different number of available processors;
– clearly indicate the number of GC threads,
– explicitly set limits on the use of direct byte buffers.
But, of course, moving around with such crutches is not very convenient, and the move to Java 10 (and then Java 11), in which all these problems are absent, was a real solution. In fairness, it is worth saying that in the eight, too, everything was fine with update 191, released in October 2018. By that time it was already irrelevant for us, which I also wish for you.
This is one example when updating the Java version gives not only moral satisfaction, but also a real profit in the form of simplified operation and increased service performance.
Docker and server class machine
So, in Java 10, appeared (and were back to Java 8) the -XX: ActiveProcessorCount and -XX: + UseContainerSupport options, taking into account the default cgroups limits. Now everything was wonderful. Or not?
Some time after we moved to Java 10/11, we began to notice some oddities. For some reason, in some services, the GC graphics looked like they did not use G1:
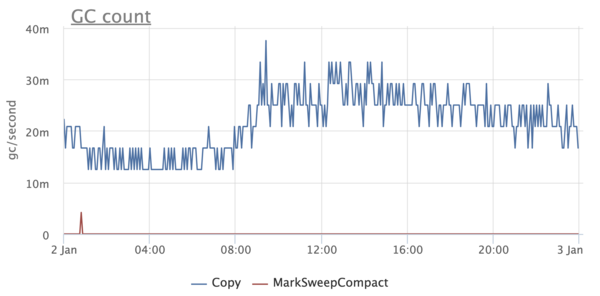
It was, a little unexpected, since we knew for sure that G1 is the default collector, starting with Java 9. At the same time, there is no such problem in some services – G1 is turned on, as expected.
We begin to understand and found an interesting thing. It turns out that if Java runs on less than 3 processors and with a memory limit of less than 2 GB, then it considers itself to be client and does not allow to use anything other than SerialGC.
By the way, this affects only the choice of GC and has nothing to do with the -client / -server and JIT compilation options.
Obviously, when we used Java 8, it did not take into account docker limits and thought that it had a lot of processors and memory. After upgrading to Java 10, many services with limits set lower suddenly started using SerialGC. Fortunately, this is treated very simply – by setting the -XX: + AlwaysActAsServerClassMachine option.
CPU limits (yes, again) and memory fragmentation
Looking at the graphs in monitoring, we somehow noticed that the Resident Set Size of the container is too large – three times more the maximum size of the heap. Could this be the case in some next tricky mechanism that scales according to the number of processors in the system and does not know about the limitations of the docker?
It turns out that the mechanism is not at all tricky – it is the well-known malloc from glibc. Shortly, so-called arenas are used in glibc to allocate memory. During the creating, each thread is assigned one of the arenas. When a thread using glibc wants to allocate a certain amount of memory in a native heap it calls malloc and then the memory is allocated in the arena assigned to it. If the arena serves several threads, then these threads will compete for it. The more arenas, the less competition, but the more fragmentation, since each arena has its own list of free areas.
On 64-bit systems, the default number of arenas is set to 8 * the number of CPUs. Obviously, this is a huge overhead for us, because not all CPUs are available to the container. Moreover, for Java-based applications, competition for arenas is not so relevant, since most allocations are done in Java-heap, the memory for which can be completely allocated at the beginning.
This feature of malloc has been known for a very long time, as well as its solution – to use the environment variable MALLOC_ARENA_MAX to clearly indicate the number of arenas. It is very easy to do for any container. Here is the effect of specifying MALLOC_ARENA_MAX = 4 for our main backend:
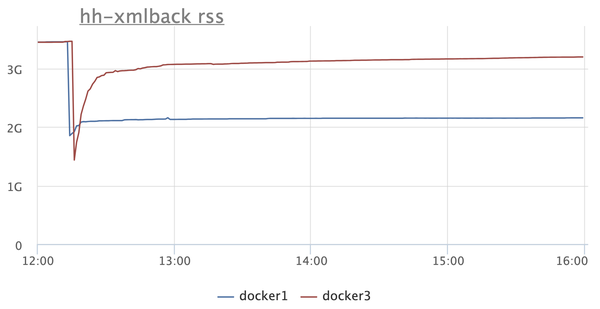
There are two instances on the RSS graph: in one (blue) we turn on MALLOC_ARENA_MAX, the other (red) we just restart. The difference is obvious.
But after that, there is a reasonable desire to figure out what Java generally spends memory on. Is it possible to run a microservice on Java with a memory limit of 300-400 megabytes and not be afraid that it will fall from Java-OOM or be hitted by a system OOM killer?