First of all, you need to prepare for the fact that OOMs are inevitable and you need to handle them correctly – at least to save heap dumps. Even this simple undertaking has its own nuances. For example, heap dumps are not overwritten – if a heap dump with the same name is already saved, then a new one will simply not be created.
Java can automatically add the dump serial number and process id to the file name, but this will not help us. The serial number is not useful, because it is OOM, and not the regularly requested heap-dump – the application restarts after it, resetting the counter. And the process id is not suitable, since in Docker it is always the same (most often 1).
Therefore, we came to this option:
-XX: + HeapDumpOnOutOfMemoryError

-XX: + ExitOnOutOfMemoryError

-XX: HeapDumpPath = / var / crash / java.hprof

-XX: OnOutOfMemoryError = "mv /var/crash/java.hprof /var/crash/heapdump.hprof"
It is quite simple and with some modifications you can even teach to store it not only the last heap dump, but for our needs this is more than enough.
Java OOM is not the only thing we have to face. Each container has a limit of the memory it occupies, and it can be exceeded. If this happens, then the container is killed by the system OOM killer and restarts (we use restart_policy: always). Naturally, this is undesirable, and we want to learn how to correctly set limits on the resources used by the JVM.
Optimizing of memory consumption
But before setting limits, you need to make sure that the JVM is not wasting resources. We have already managed to reduce memory consumption by using a limit on the number of CPUs and the variable MALLOC_ARENA_MAX. Are there any other “almost free” ways to do this?
It turns out that there are a couple more tricks that will save a little memory.
The first is the use of the -Xss (or -XX: ThreadStackSize) option, which controls the stack size for threads. The default for a 64-bit JVM is 1 MB. We found out that 512 KB is enough for us. Because of this, a StackOverflowException has never been caught before, but I admit that this is not suitable for everyone. And the profit from this is very small.
The second is the flag –XX: + UseStringDeduplication (with G1 GC turned on). It allows you to save on memory by collapsing duplicate rows due to additional processor load. The tradeoff between the memory and the CPU depends only on the specific application and the settings of the deduplication mechanism itself.
And finally, a method that is not suitable for everyone is to use jemalloc instead of the native malloc. This implementation is focused on reducing memory fragmentation and better multithreading support compared to malloc from glibc. For our services, jemalloc gave a little more memory gain than malloc with MALLOC_ARENA_MAX = 4, without significantly affecting performance.
Now, let’s move on to the next topic and, finally, try to learn how to limit memory consumption and select the correct limits.
Memory consumption limiting: heap, non-heap, direct memory
To do everything right, you need to remember what memory in Java consists of. First, let’s look at the pools whose status can be monitored through JMX.
The first, of course, is heap. It’s simple: we ask -Xmx, but how to do it right? Unfortunately, there is no universal recipe here, it all depends on the application and the load profile. For new services, we start with a relatively reasonable heap size (128 MB) and, if necessary, increase or decrease it. To support existing ones, there is monitoring with graphs of memory consumption and GC metrics.
At the same time as -Xmx we set -Xms == -Xmx. We don’t have memory overselling, so it’s in our interests that the service use the resources that we gave it to the maximum. In addition, in ordinary services we include -XX: + AlwaysPreTouch and the Transparent Huge Pages mechanism: -XX: + UseTransparentHugePages -XX: + UseLargePagesInMetaspace. However, before enabling THP, carefully read the documentation and test how services behave with this option for a long time. Surprises are excluded on machines with insufficient RAM (for example, we had to turn off THP on test benches).
Next is non-heap. Non-heap memory includes:
- Metaspace and Compressed Class Space,
- Code Cache.
Of course, everyone has heard about Metaspace, I won’t talk about it in detail. It stores class metadata, method bytecode, and so on. In fact, the use of Metaspace directly depends on the number and size of the loaded classes, and you can determine it, like heap, only by launching the application and removing the metrics via JMX. By default, Metaspace is not limited by anything, but it is quite easy to do this with the -XX: MaxMetaspaceSize option.
Compressed Class Space is part of Metaspace and appears when the -XX: + UseCompressedClassPointers option is enabled (enabled by default for heaps less than 32 GB, what means, it can give a real memory gain). The size of this pool can be limited by the -XX: CompressedClassSpaceSize option, but there isn’t much sense, since Compressed Class Space is included in Metaspace and the total amount of locked memory for Metaspace and Compressed Class Space is ultimately limited to one –XX: MaxMetaspaceSize option.
By the way, if you look at the JMX readings, then the amount of non-heap memory is always calculated as the sum of Metaspace, Compressed Class Space and Code Cache. In fact, you only need to summarize Metaspace and CodeCache.
So, in non-heap only remained Code Cache – the repository of code compiled by the JIT compiler. By default, its maximum size is set to 240 MB, and for small services it is several times larger than necessary. The size of the Code Cache can be set with the -XX: ReservedCodeCacheSize option. The correct size can only be determined by running the application and following it under a typical load profile.
It is important not to make a mistake here, since insufficient Code Cache leads to the removal of cold and old code from the cache (option -XX: + UseCodeCacheFlushing is enabled by default), and this, in turn, can lead to higher CPU consumption and performance degradation. It would be great if you could use OOM when Code Cache overflows, there’s even the -XX: + ExitOnFullCodeCache flag for this, but, unfortunately, it is only available in the development version of the JVM.
The last pool about which there is information in JMX is direct memory. By default, its size is not limited, so it is important to set some kind of limit for it – at least for libraries like Netty, which actively use direct byte buffers. It is not difficult to set a limit using the -XX: MaxDirectMemorySize flag, and, again, only monitoring will help us to determine the correct value.
So what do we get so far?
Java process memory =

    Heap + Metaspace + Code Cache + Direct Memory =

        -Xmx +

        -XX: MaxMetaspaceSize +

        -XX: ReservedCodeCacheSize +

        -XX: MaxDirectMemorySize
Let’s try to draw everything on the chart and compare it with the RSS docker container.
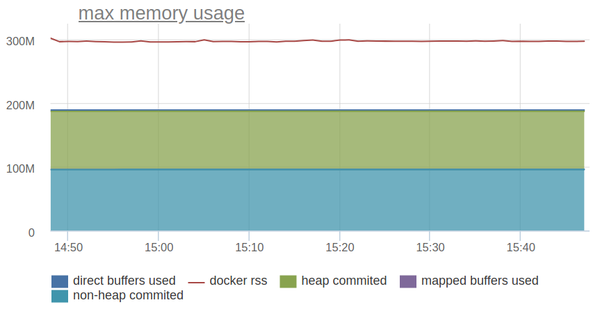
The line above is the RSS of the container and it is one and a half times more than the memory consumption of the JVM, which we can be monitored through JMX.
Check our next article and let’s dive deeper!