Of course, in addition to heap, non-heap and direct memory, the JVM uses a lot of other memory pools. The -XX flag will help us to deal with them: NativeMemoryTracking = summary. By enabling this option, we will be able to get information about pools known to the JVM, but not available in JMX.
Let’s start with the most obvious – the memory occupied by the stacks of threads. NMT produces for our service something like this:
Thread (reserved = 32166KB, committed = 5358KB)

    (thread # 52)

    (stack: reserved = 31920KB, committed = 5112KB)

    (malloc = 185KB # 270)

    (arena = 61KB # 102)
By the way, its size can also be found without Native Memory Tracking, using jstack and digging a bit into / proc / <pid> / smaps.
The size of the Shared Class Space is even easier to evaluate:
Shared class space (reserved = 17084KB, committed = 17084KB)

(mmap: reserved = 17084KB, committed = 17084KB)
This is the Class Data Sharing mechanism, enabled by the -Xshare and -XX: + UseAppCDS options. In Java 11, the -Xshare option is set to auto by default, which means that if you have the $ JAVA_HOME / lib / server / classes.jsa archive (it is in the official OpenJDK docker image), it will load the memory map, by starting the JVM, speeding up the startup time. Accordingly, the size of Shared Class Space is easy to determine if you know the size of jsa archives.
The following are the native garbage collector structures:
GC (reserved = 42137KB, committed = 41801KB)

    (malloc = 5705KB # 9460)

    (mmap: reserved = 36432KB, committed = 36096KB)
One manual on Native Memory Tracking says that in their company they occupy about 4-5% of the size of the heap, but in our setup for small heap (up to several hundred megabytes) the overhead reached 50% of the size of the heap.
A lot of space can be occupied by symbol tables:
Symbol (reserved = 16421KB, committed = 16421KB)

    (malloc = 15261KB # 203089)

    (arena = 1159KB # 1)
They store the names of methods, signatures, as well as links to interned strings. Unfortunately, it seems possible to estimate the size of the symbol table only post factum using Native Memory Tracking.
What is left? According to Native Memory Tracking, quite a lot of things:
Compiler (reserved = 509KB, committed = 509KB)

Internal (reserved = 1647KB, committed = 1647KB)

Other (reserved = 2110KB, committed = 2110KB)

Arena Chunk (reserved = 1712KB, committed = 1712KB)

Logging (reserved = 6KB, committed = 6KB)

Arguments (reserved = 19KB, committed = 19KB)

Module (reserved = 227KB, committed = 227KB)

Unknown (reserved = 32KB, committed = 32KB)
But all this takes up quite a bit of space.
Unfortunately, many of the mentioned areas of memory can neither be limited or controlled, and if it could be, the configuration would turn into hell. Even monitoring their status is not a trivial task, since the inclusion of Native Memory Tracking slightly reduces the performance of the application and enabling it on production in a critical service is not a good idea.
Nevertheless, for the interest, let’s try to reflect on the graph everything that Native Memory Tracking reports:
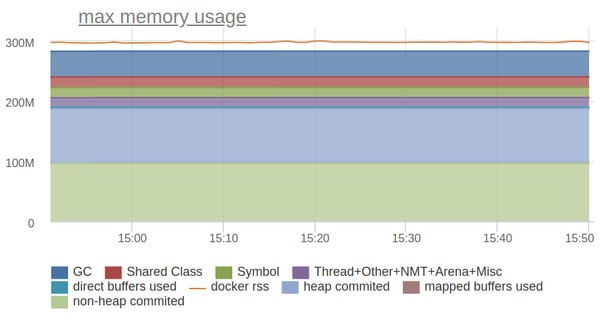
Not bad! The remaining difference is an overhead for fragmentation / allocation of memory (it is very small, since we use jemalloc) or the memory that native libs allocated. We just use one of these for efficient storage of the prefix tree.
So, for our needs, it’s enough to limit what we can: Heap, Metaspace, Code Cache, Direct Memory. For everything else, we leave some reasonable groundwork, determined by the results of practical measurements.
Having dealt with the CPU and memory, we move on to the next resource for which applications can compete – to the disks.
Java and disks
And with them everything is very bad: they are slow and can lead to errors of the application. Therefore, we unbind Java from disks as much as possible:
We write all application logs to the local syslog via UDP. This leaves some chance that the necessary logs will be lost somewhere along the way, but, as practice has shown, such cases are very rare.
We will write JVM logs in tmpfs, for this we just need to put the docker to the desired location with the / dev / shm volume.
If we write logs in syslog or in tmpfs, and the application itself does not write anything to the disk except for heap dumps, then it turns out that the story with disks can be closed on this?
Of course not.
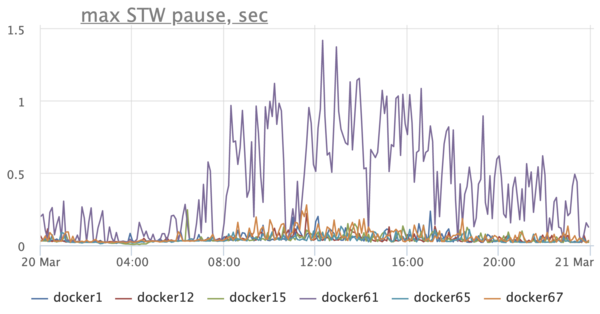
We pay attention to the graph of the duration of stop-the-world pauses and we see a sad picture – Stop-The-World-pauses on hosts are hundreds of milliseconds, and on one host they can reach up to a second:
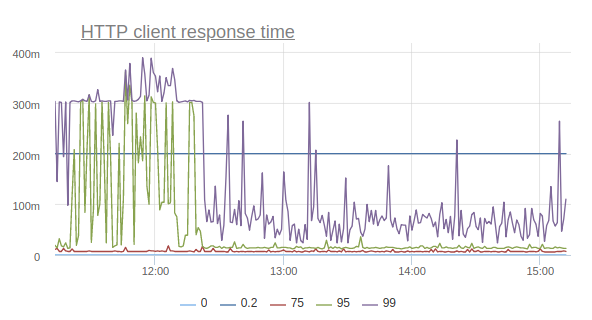
Needless to say that this negatively affects the application? Here, for example, is a graph that reflects the response time of the service according to customers:
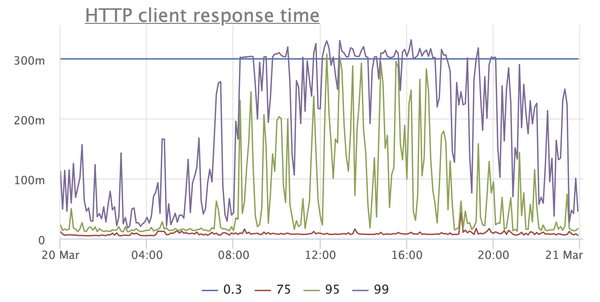
This is a very simple service, for the most part giving cached answers, so from where there are such prohibitive timings, starting from the 95th percentile? Other services have a similar picture, moreover, timeouts are here with enviable constancy when taking connection from the connection pool to the database, when executing requests, and so on.
What does disk have to do with it? – you ask. It turns out very much to do with it.
A detailed analysis of the problem showed that long STW-pauses arise due to the fact that the threads go to the safepoint for a long time. After reading the JVM code, we realized that during the synchronization of threads on the safepoint, the JVM can write the file / tmp / hsperfdata * through the memory map to which it exports some statistics. Utilities like jstat and jps use these statistics.
Disable it on the same machine with the option -XX: + PerfDisableSharedMem and …
Jetty treadpool metrics stabilize:
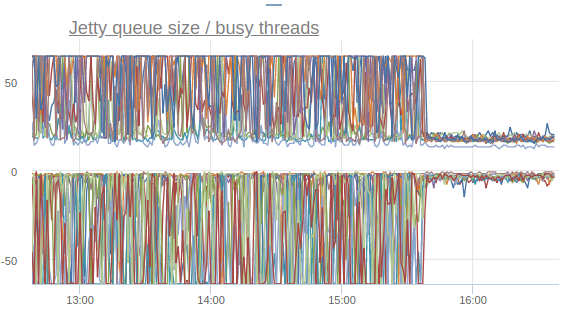
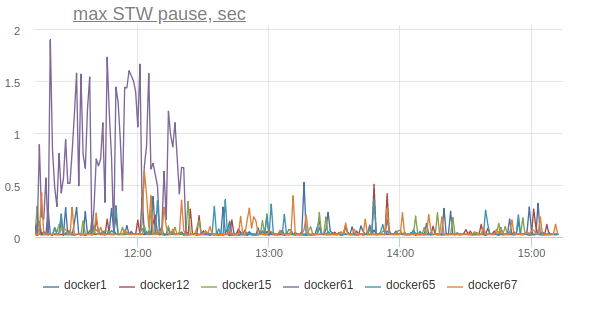
And the response time percentiles begin to bounce back (I repeat, this is the effect of enabling the option on only one machine):
Thus, by turning off one option, we were able to reduce the number of timeouts, the number of retries, and even correct the general percents of the response time of the site.
How to keep tracking everything?
In order to support Java services in the Docker, you must first learn how to follow them.
We launch our services on the basis of our own Nuts and Bolts framework, and therefore we can check all critical places with the metrics we need. In the future, this greatly helps in the investigation of incidents and, in general, in understanding how the service lives on production. We send metrics to statsd, in practice it is more convenient than JMX.
By metrics, we try to build graphs that reflect the internal state of the service and allow us to quickly diagnose the causes of anomalies. Some of these graphs I have already cited as an example above.
We also send statsd and internal JVM metrics, such as memory consumption (heap, correctly counted non-heap and the whole picture):
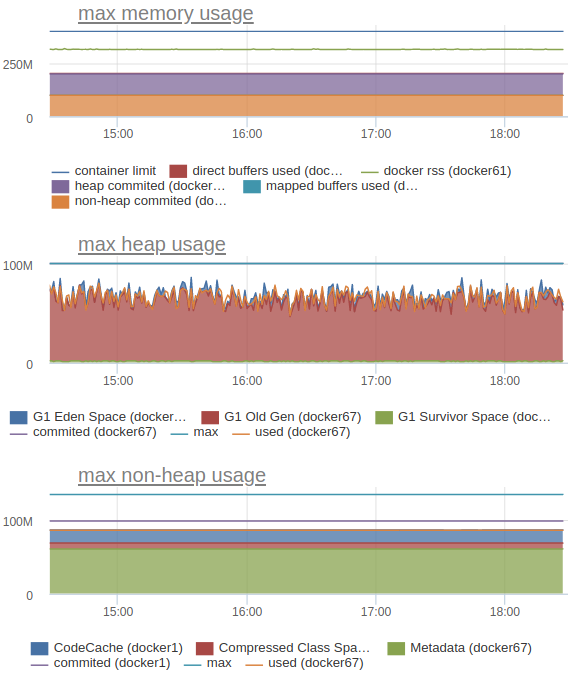
In particular, this allows us to understand what limits to set for each specific service.
And finally – how to constantly monitor that the limits are set correctly, and the services that live on the same host do not interfere with each other? In this, daily stress testing greatly helps us. Since we (so far) have two data centers, the load testing is configured to double the RPS on the site.
The mechanism of load testing is very simple: in the morning, starts the crown, which parses the logs for the previous hour and forms a profile of a typical anonymous load from them. A number of employer and job pages are added to the anonymous load. After that, the load profile is exported to the ammo-file format for Yandex.Tank. At a given time, Yandex.Tank starts:
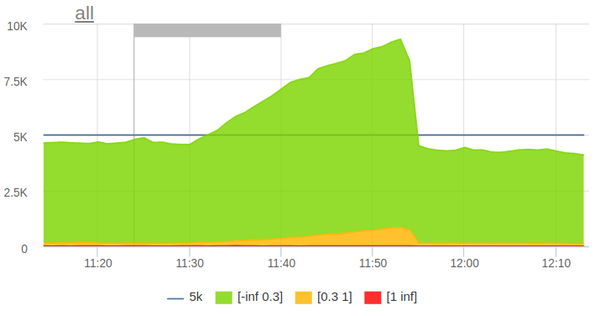
The load automatically stops when a small threshold of five hundred is exceeded.
During its existence, stress testing allowed us to identify a number of problems even before they affected real users. In addition, it gives us confidence that when one data center falls out, the other survivor will withstand the entire load.
Summary
Our experience shows that Java in Docker is not only convenient, but also quite economical. You just need to learn how to use it.